
Two senders can have the exact same 43 spam complaints this month and walk away with two different verdicts about their standing. One reads their spam complaint rate as 0.09%, comfortably under Google’s 0.1% target. The other reads the same 43 complaints as 0.10%, sitting right on the line. You could be either one and not know it. Nothing about the complaints changed. What changed is which number they used to measure. That gap is not a rounding error. It’s the reason a sender can genuinely believe they are safe while Google’s own systems are already treating them as borderline.
Most guides to spam complaint rate skip straight past this. They give you a formula, the 0.1% and 0.3% thresholds everyone quotes, and generic advice about clean lists and easy unsubscribe links. What they don’t tell you is that the formula itself changes the answer. The formula Google actually uses in Postmaster Tools is not the one most calculators default to. If you’ve ever checked your ESP’s dashboard and felt reassured by a low email spam rate, read this before you trust it.
That’s the real subject here: which formula the providers actually use, and why your number can look completely different from what your ESP reports. Once you’re measuring the right one, what to actually do about it changes too.
TL;DR on Email Spam Complaint Rate
- Spam complaint rate has at least three different formulas circulating across the industry, and they can produce different answers from the same campaign.
- Google’s own Postmaster Tools documentation defines the rate against inbox-delivered messages marked as spam, excluding bounces and already-filtered spam mail, not against total emails sent.
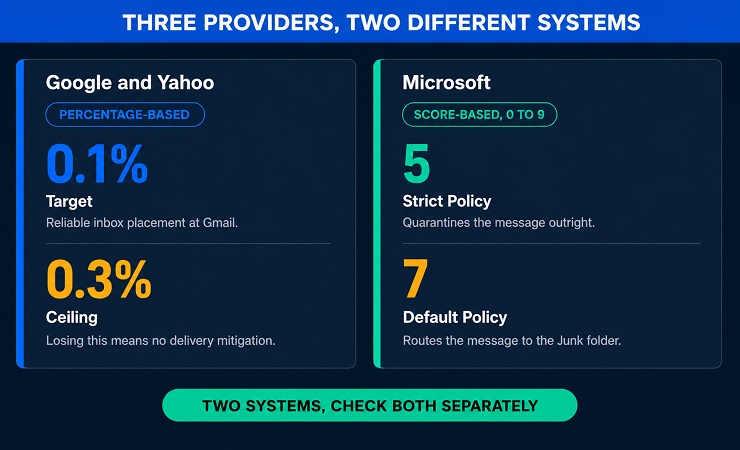
- Google and Yahoo both enforce a 0.3% complaint-rate ceiling, with Google targeting under 0.1% for reliable inbox placement.
- Crossing that ceiling removes eligibility for Google’s delivery mitigation support until the rate holds below it for seven consecutive days.
- Microsoft doesn’t grade complaint rate as a percentage, using a 0 to 9 Bulk Complaint Level score with its own action thresholds instead.
- List composition drives complaint risk directly: role-based addresses, decayed contacts, and spam traps generate complaints authentication alone cannot prevent.
- Spam complaint rate and spam placement rate are two different metrics measuring two different things, and benchmark data conflating them is a common, avoidable mistake.
- Whether a sender can identify which recipient complained depends on the provider. Gmail never reveals it, Yahoo does at the campaign level, and Microsoft’s JMRP recently stopped revealing individual complainers too.
- Fixing content and cadence rarely moves the number if the real driver is list quality, which is usually the bigger factor of the two.
What Is Spam Complaint Rate, and Why the Formula You Use Actually Matters
What is email spam, exactly? Not just anything unwanted. A spam complaint rate measures the percentage of your emails that a recipient actively reports as email spam, rather than simply ignoring or deleting it. It is not a bounce, and it is not a low open rate. It is a real person, looking at a message that reached them and choosing the option that tells their mailbox provider they didn’t want it.
That single action carries more weight than almost any other signal mailbox providers track as part of your overall email deliverability. A bounce tells a provider your list has bad addresses. A spam complaint tells them your own recipients don’t trust what you’re sending. Providers treat that as a much stronger reason to start filtering your future mail.
How a Complaint Actually Gets Logged
Most complaints happen one of two ways, and the practical email spam meaning is the same either way. The recipient clicks “Report spam,” “This is spam,” or a similar button inside their inbox, and their mailbox provider logs it immediately. Some recipients take a second, less obvious route. They open the unsubscribe flow and select spam as their reason for leaving, rather than completing a plain unsubscribe. Both count against you the same way, even though only one of them looks like a complaint from the outside.
Mailbox providers pass some of this data back to you through feedback loops, which is where any email spam report you check actually comes from. That lets you see which addresses drove your spam complaint rate up so you can remove them. Not every provider shares that detail, and Gmail specifically does not, which is exactly why the calculation question matters as much as it does.
The Complaint Rate Formula: Sent vs. Delivered vs. Delivered-to-Inbox
Ask five different sources how to calculate spam rate in email marketing and you’ll likely get three different formulas back. That’s before even asking what is email spam in the first place. That’s not a hypothetical question about your spam complaint rate. There isn’t one universal email spam rate formula, whatever most calculators imply. Since the denominator is the whole calculation, that’s not a minor detail.
The Three Denominators, Compared
Here is what each approach to calculating spam complaint rate actually excludes, and where you’re likely to encounter it:
| Denominator | Formula | What’s Excluded | Where You’ll See It |
|---|---|---|---|
| Total sent | Complaints ÷ Total sent × 100 | Nothing | Simplified explainers and some ESP dashboards |
| Delivered | Complaints ÷ Delivered × 100 | Bounced messages | Most spam complaint rate calculators and glossaries |
| Delivered to inbox | Complaints ÷ Inbox-delivered × 100 | Bounces and messages already filtered to spam | Google’s own Postmaster Tools |
The first two approaches share a real problem: they count people who never had the chance to complain about your email. A recipient whose message bounced never saw it. Neither did a recipient whose message landed straight in their spam folder, at least not in the place most people check. Only the third approach counts exclusively the population that could plausibly have clicked “report spam” on your email. That’s why it’s the one the provider setting the actual threshold uses.
Which One Google and Yahoo Actually Use
Google calls this metric spam rate in its own documentation, not spam complaint rate. It’s the same thing the rest of the industry means by the more common term. Google’s own Postmaster Tools documentation defines it as messages delivered to an engaged recipient’s inbox and then marked as spam.
There’s a specific wrinkle worth knowing, one no generic email spam report explainer mentions. If Gmail initially sends a message to spam and the recipient later marks it “not spam,” that message counts as inbox-delivered in Google’s own math. Google states this directly, which tells you the calculation is tracking actual inbox exposure, not just where a message was originally routed.
Yahoo’s own published guidance sets the same 0.3% ceiling but doesn’t spell out its denominator with the same precision Google does. The two providers’ bulk sender requirements already track each other closely elsewhere. Treating your Yahoo-facing rate the same way, against inbox-delivered mail specifically, is the safer assumption until Yahoo states otherwise.
Why the Gap Between Them Is Bigger Than It Looks
Run the same spam complaint rate calculation through all three formulas and the gap stops being theoretical. Say you send 50,000 emails, and 2,500 bounce, leaving 47,500 delivered. Of those, 4,750 get filtered straight to Gmail’s spam folder before anyone sees them, leaving 42,750 that actually reach an inbox. Now say 43 people mark your email as spam. Here’s what each formula tells you:
- Against total sent: 43 ÷ 50,000 = 0.086%
- Against delivered: 43 ÷ 47,500 = 0.091%
- Against delivered to inbox: 43 ÷ 42,750 = 0.101%
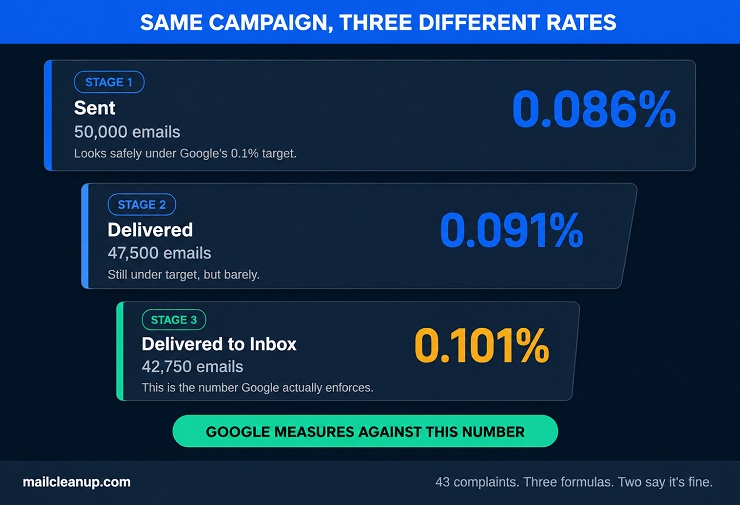
The same 43 complaints. The same campaign. One formula says you’re comfortably under Google’s 0.1% target. Another says you’ve already crossed it. If you’re only checking your ESP’s sent-based number, you could be sitting past the line Google actually enforces without any warning at all.
Once you know which email spam complaint rate number actually matters, the next question is what happens when that number gets too high.
Spam Complaint Rate Thresholds: What Google, Yahoo, and Microsoft Actually Enforce
Once your spam complaint rate crosses from acceptable to a problem, what happens next depends entirely on which mailbox provider is doing the counting. A rising email spam rate means something different at each one. Google and Yahoo share the same percentage ceiling. Microsoft doesn’t use a percentage at all. These three thresholds sit inside a much bigger compliance picture. If you haven’t confirmed your authentication and unsubscribe setup meet Google and Yahoo’s full bulk sender requirements, check that first.
The Severity Range Between Fine and Blocked
Here’s how the three providers actually measure your spam complaint rate once it becomes a problem:
| Provider | How It Measures | The Line | What Crossing It Costs You |
|---|---|---|---|
| Percentage, complaints ÷ inbox-delivered mail | 0.3% ceiling, 0.1% target | Loses eligibility for delivery mitigation support | |
| Yahoo | Same 0.3% percentage ceiling, denominator not published with the same precision | 0.3% | Increased filtering, per its own bulk sender guidance |
| Microsoft | A 0 to 9 Bulk Complaint Level (BCL) score, not a percentage | Default policy acts at BCL 7, Strict policy at BCL 5 | Message routed to Junk, or quarantined under Strict policy |
Google’s own guidance describes what happens between 0.1% and 0.3% as graduated, not a cliff. Damage to your delivery starts building before you actually cross the ceiling. A rate sitting at 0.25% is already worse off than one at 0.15%, even though neither has technically failed yet. Raw email spam statistics from one provider alone don’t tell you the full story.
Microsoft works completely differently. Instead of a percentage, Microsoft 365 assigns every bulk message a Bulk Complaint Level score from 0 to 9. The score reflects how many complaints that sending pattern has generated. The default policy routes anything scoring 7 or higher to the recipient’s Junk folder. Microsoft’s Strict policy goes further, quarantining mail at a BCL of 5 or higher instead. If you’ve only ever checked Google Postmaster Tools, Microsoft’s complaint threshold has been invisible to you the whole time. Microsoft’s own email spam report lives in a completely different dashboard. Checking your email spam score alongside your BCL standing gives a fuller picture than either number alone.
Crossing any of these lines feeds directly into your sender reputation with that provider. Reputation, not any single metric, ultimately decides where your mail lands.
The Seven-Day Recovery Rule
Google’s spam complaint rate ceiling of 0.3% isn’t just a line you cross once and forget. Once you cross it and lose mitigation eligibility, regaining it requires seven consecutive days under 0.3%, not seven days scattered across a longer stretch.
One bad day partway through resets the count back to zero, even after six clean days in a row. A sender who spends three weeks hovering between 0.2% and 0.4% never actually starts that seven-day clock. Dipping under the ceiling some days and crossing it on others doesn’t count, no matter how many individually good days show up in between.
What Actually Drives Your Spam Complaint Rate Up
Every threshold in the section above is measuring the same underlying driver of your spam complaint rate. How often what you send makes someone angry enough to complain comes down to four recurring categories. A rising email spam rate is always traceable to one of them.
Content and Cadence Problems
Four content and cadence habits show up again and again in a rising spam complaint rate. Running a draft through an email spam checker tool catches some of them before you send:
- Content that doesn’t match expectations: a subscriber who signed up for one thing and gets something else reaches for the spam button fast.
- A subject line the body doesn’t deliver on: a recipient who opens expecting one thing and finds another feels misled, and misled reads as spam.
- Sending more often than promised: frequency creep is one of the most common, least noticed causes, since nobody agreed to the new pace.
- A sender identity nobody recognizes: a changed From name, a new domain, or a long gap since your last send all work against you.
- Skipping a basic content check before sending: an email spam content checker gives you an email spam score and flags obvious issues. It still won’t catch a bad list.
None of this touches list quality, which is a completely separate risk category and usually the bigger one. The two are also diagnosable separately. A complaint spike concentrated in one specific send usually points back to that campaign’s own subject line or content. It’s a promise the subject made that the body didn’t keep. A slower, steady climb across every campaign points somewhere else entirely, usually cadence or a sender identity that’s drifted, not any single message.
List Quality Problems
List quality problems drive your spam complaint rate differently than content does. No amount of great copywriting fixes them. The recipient never engages with your content at all, because the problem sits in who’s on your list, not what you sent them.
| Risk Type | Why It Complains | Caught By |
|---|---|---|
| Role-based addresses | A shared inbox like info@ or support@ has no single owner who remembers opting in, so whoever opens it decides, and marking it spam is the easy option | Address-type detection during verification |
| Decayed or disengaged contacts | Someone who hasn’t opened anything in months forgets they ever signed up, so a message arriving out of nowhere reads as unsolicited | Engagement-based list decay tracking |
| Spam traps | An address seeded specifically to catch senders with poor list hygiene; hitting even one damages reputation more than thousands of ordinary bounces | Spam trap identification during verification |
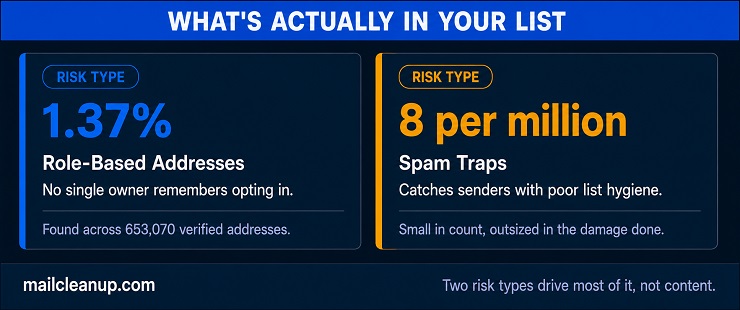
MailCleanup’s own verification data puts this in real numbers. Across 653,070 verified addresses, role-based addresses alone made up 1.37% of the total. Spam traps showed up at roughly 8 per million, small in isolation but disproportionate in the damage a single hit causes. None of these addresses look like a problem until someone reaches for the spam button, or an automated trap does it for them.
Some addresses are simply prone to filing complaints no matter what you send, sometimes labeled an abuse email once the pattern repeats. Regular list hygiene catches these tendencies before a campaign goes out, not after. Tracking the same list over time the way our own decay research does shows exactly how fast a clean list stops staying that way. That’s also why spam traps do so much damage from such a small number of addresses.
Different Campaign Types Carry Different Baseline Risk
Not every email you send carries the same risk to your spam complaint rate. No provider publishes official email spam statistics broken out by campaign type. The pattern deliverability practitioners consistently observe still holds regardless of the exact numbers involved.
Ranked roughly from lowest complaint risk to highest, based on how recently and clearly a recipient agreed to hear from you:
- Transactional and account messages (receipts, password resets): recipients expect these regardless of marketing preferences, and complaints here usually signal a technical problem.
- Welcome emails: sent immediately after signup, when the opt-in is freshest in the recipient’s memory.
- Regular newsletters to an engaged list: recipients who open and click regularly have demonstrated, recent interest.
- Promotional and seasonal campaigns: higher volume and broader targeting naturally pull in less-engaged segments of the same list.
- Re-engagement sends to inactive contacts: by definition targeting people who’ve stopped responding, some complaint risk here is expected and shouldn’t trigger panic.
- Cold outreach to purchased or scraped lists: no opt-in exists at all, which is the highest-risk category regardless of content quality.
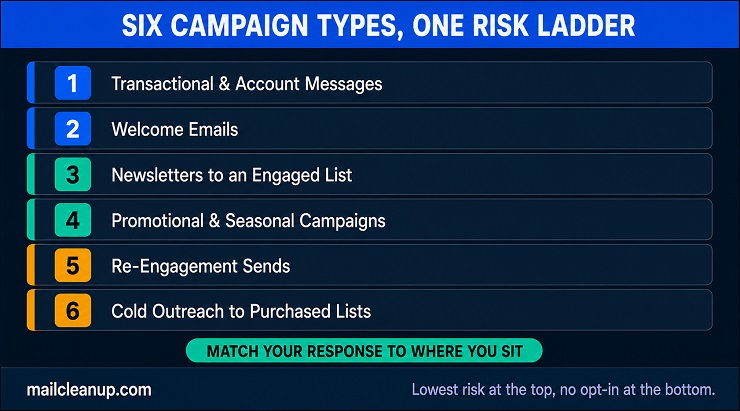
Where you fall on this list should inform how much a given complaint bump worries you. A slightly elevated rate on a cold outreach campaign is expected. The same bump on a welcome series is a real signal something’s broken.
How to Reduce Your Spam Complaint Rate: A Prioritized Strategy
Reducing your spam complaint rate is not four unrelated tips. It’s a sequence, and doing them out of order wastes effort on the parts that matter least.
Fix the List First
List quality is usually the bigger driver, so fixing your spam complaint rate starts there too, not with a content rewrite. The order matters. Content and cadence fixes on top of a list full of role-based addresses and disengaged contacts treat the symptom while leaving the cause in place.
Fixing your spam complaint rate this way means three concrete things, matched directly to the risk types from the table above:
- Suppressing or deprioritizing role-based addresses, since no single person owns that inbox or remembers opting in.
- Re-verifying the list on a recurring schedule, not a one-time check at signup, since list decay is continuous.
- Screening out spam traps before a send, since a single hit does more damage than a much larger batch of ordinary bounces.
This is the specific place list verification earns its keep. It doesn’t touch your subject lines or your send times. It just makes sure the audience you’re measuring complaints against is actually the audience you meant to reach. How often to re-verify depends on how actively you’re sending, but MailCleanup’s own decay tracking found the pace itself isn’t constant. Decay accelerates the longer a list goes since its last cleaning, so a quarterly cadence catches far less than a tighter one would.
Make the Exit Easier Than the Complaint Button
Every complaint that shows up in your spam complaint rate is a recipient choosing the harder path when an easier one should have been available. One-click unsubscribe exists specifically to make that comparison lopsided in your favor.
- A visible, working unsubscribe link in every commercial message: buried or broken links push a frustrated recipient toward the spam button instead.
- True one-click behavior, not a login wall or preference-center maze: every extra step is another chance to give up and complain instead.
- Unsubscribe requests honored within the window your provider requires: a delayed removal often generates the exact complaint it was supposed to prevent.
None of this is complicated engineering. It’s making the door out at least as easy to find as the report-spam button already is.
Match Expectations and Sending Cadence
Your spam complaint rate also reflects whether reality matched what a recipient expected when they signed up. A recipient who signed up expecting a weekly digest and gets a daily promotional blast is reacting to a broken promise. It’s not a personal grudge against your brand.
A confirmed double opt-in process helps here directly. A recipient who actively confirmed their subscription remembers doing it, and is far less likely to mark a later email as unwanted or unrecognized.
- Keep a consistent, predictable rhythm, and say so explicitly when breaking from it, like for a holiday push, instead of letting volume speak for itself.
- Test any cadence increase against a small, recently-engaged segment first. A frequency jump a fresh subscriber absorbs without complaint can hit a subscriber who joined a year ago and has since gone quiet very differently.
Segment by Engagement Before Volume Increases
Any time sending volume is about to increase, whether for a seasonal push or a new campaign type, engagement segmentation should happen first. It shouldn’t be an afterthought once complaints start showing up.
| Engagement Tier | Definition | Before a Volume Increase |
|---|---|---|
| Highly engaged | Opened or clicked within the last 30-60 days | Safe to include at full frequency |
| Lightly engaged | Opened within 90-180 days, little to no clicking | Include, but watch complaint activity closely |
| Disengaged | No opens in 180+ days | Hold back or move to a separate re-engagement track first |
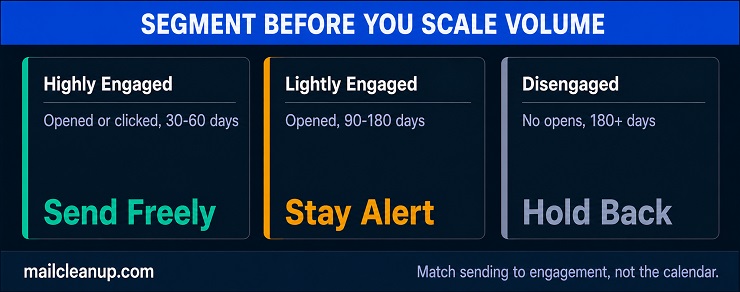
This matters most right before exactly the kind of push a Black Friday campaign represents, which gets a full volume breakdown of its own. Sending that same volume increase only to the top two tiers protects your spam complaint rate while still reaching recipients likely to respond.
How to See Which Recipients Are Actually Complaining
Everything so far has been about the rate itself and what drives it. Knowing your spam complaint rate is 0.15% tells you there’s a problem. Postmaster Tools gives you an email spam report showing your rate over time, but not the individual complainers behind it.
Getting that specific answer depends entirely on which provider you’re asking, and the honest answer is that you often can’t get it at all. Here’s what each one’s feedback loop actually reveals:
| Provider | What Its Feedback Loop Reveals |
|---|---|
| Gmail | Aggregate spam-rate data only, through Postmaster Tools. Never identifies an individual complaining recipient. |
| Yahoo | Identifies complaints at the campaign and list level once you’re enrolled in its domain-based feedback loop. |
| Microsoft (JMRP) | Used to name the specific complaining recipient. As of a 2026 platform change, that address is now redacted. |
Microsoft’s shift is the one worth flagging specifically. A lot of guidance still circulating describes an identify-and-suppress workflow built on JMRP data that no longer works now that the address is redacted.
Setting any of these up, the registration process and the full mechanics behind each format, is covered in feedback loops rather than repeated here. One thing worth carrying forward: for Gmail specifically, no feedback loop tells you who complained. An address behaving like an abuse email on Gmail specifically stays invisible there until it shows up in your aggregate rate. The list-quality work from earlier in this guide is the only lever you actually have there.
Common Spam Complaint Rate Mistakes
- Comparing your rate to Google’s threshold using the wrong denominator. Comparing your rate to Google’s 0.1% target while calculating it against total sent, not inbox-delivered mail, is the single most common version of this mistake. The math from earlier in this guide is the fix. The wrong email spam rate formula produces a falsely reassuring number.
- Treating spam placement rate and spam complaint rate as the same number. Placement rate measures what percentage of your mail a filter routes to the spam folder automatically, a different email spam meaning than complaint rate tracks. Complaint rate measures what percentage of delivered mail a human then actively reports. A benchmark citing one while you’re tracking the other will never match, no matter how healthy either number actually is.
- Reacting to a single day’s spike as if it were a trend. Google calculates spam rate daily, not as a monthly average, and a single badly-targeted send can spike your daily number for that one day alone. A monthly average sitting at a comfortable 0.04% can hide a single Wednesday that hit 0.6%. The spike, not the average, is what actually gets evaluated. Aggregated email spam statistics checked only once a month can hide exactly this kind of problem.
- Assuming Yahoo and Microsoft tolerate the same rate Gmail does. The two providers publish similar numbers, but Yahoo’s own reputation system responds more aggressively at rates Gmail would still tolerate. Microsoft doesn’t grade on a percentage at all. Monitoring Gmail alone and assuming the others are fine leaves two-thirds of your reputation risk unwatched.
- Fixing content when the actual driver is list quality. A rewritten subject line and a cleaner send schedule feel like progress. But if role-based addresses, decayed contacts, or spam traps are generating the complaints, none of that content work moves your spam complaint rate at all. The list has to be the first fix, not the last one tried.
- Chasing zero instead of a sustainable low number. An extremely low spam complaint rate isn’t always a good sign. Google’s own documentation notes that an unusually low rate can mean something is distorting the data, not confirming a clean program. Real engagement almost always generates a small, steady number of complaints on its own. A clean pass through an email spam content checker doesn’t guarantee a clean complaint rate either.
Start Monitoring Your Real Spam Complaint Rate This Week
Everything in this guide points to the same handful of concrete steps for getting your spam complaint rate under control. More precisely, this is about your email spam complaint rate specifically, not deliverability in general. Here’s the order that actually works, starting today rather than waiting for your next scheduled review.
- Confirm which denominator your current dashboard uses, and mentally translate it to the inbox-delivered basis Google actually enforces before comparing it to any published threshold.
- Set up Google Postmaster Tools if you haven’t, and check Yahoo’s and Microsoft’s programs too. A clean email spam report from Gmail tells you nothing about the other two.
- Run a verification pass on your active list before your next send. Role-based addresses, decayed contacts, and spam traps are still the most common driver behind an elevated rate.
- Watch your daily email spam rate numbers, not just your monthly average, since a single bad day is what actually triggers enforcement. Weekly or monthly email spam statistics alone won’t show you that.
None of these four steps requires new software you don’t already have access to, apart from a verification pass if you haven’t run one recently. A quick pass through an email spam checker tool on this week’s drafts takes just as little time. Start with whichever one worries you most today, since that’s where the real risk is sitting.
FAQs on Spam Complaint Rate
What is a good spam complaint rate?
Under 0.1% is the widely cited target, matching Google’s own published guidance for reliable inbox placement at Gmail. Yahoo enforces the same 0.3% hard ceiling as Google but doesn’t publish as precise a target number. Anything sitting comfortably under 0.1%, calculated against inbox-delivered mail rather than total sent, is considered healthy across major providers.
How is spam complaint rate calculated?
Calculating spam rate in email marketing sounds simple: complaints divided by the relevant volume, times 100. But which volume you use changes the answer significantly. Many calculators default to total emails sent. Google’s own Postmaster Tools instead calculates against messages delivered to the inbox specifically, excluding both bounces and mail already filtered to spam. That’s the version that actually matters for compliance.
What’s the difference between spam complaint rate and spam placement rate?
Placement rate measures the percentage of your email a spam filter automatically routes to the junk folder before anyone sees it. Complaint rate measures the percentage of delivered mail that a recipient actively marks as spam after seeing it. They’re driven by different mechanisms and can move in opposite directions, so a benchmark for one shouldn’t be applied to the other.
What happens if my spam complaint rate is too high?
Crossing Google’s 0.3% ceiling removes your eligibility for delivery mitigation support until the rate holds below that line for seven consecutive days. Below the ceiling but above the 0.1% target, damage is graduated rather than sudden, meaning delivery quietly worsens the longer the rate stays elevated. Some ESPs also place accounts with sustained high complaint rates under manual review.
Can I see who reported my email as spam?
It depends entirely on the provider. Gmail’s feedback loop reports aggregate spam-rate data only and never identifies individual complainers, regardless of how the data is accessed. Yahoo’s feedback loop identifies complaints at the campaign level once you’re enrolled. Microsoft’s JMRP used to name the specific recipient but now redacts that address following a 2026 platform change.
Can one bad campaign permanently damage my spam complaint rate?
Not permanently, but the effect lasts longer than most senders expect. Google calculates the rate daily rather than as a rolling monthly average. One poorly-targeted send can spike a single day’s number sharply even while your overall average looks fine. That daily spike, not the monthly average, is what providers actually respond to, and recovery from it takes real time.
What’s a normal spam complaint rate for cold email or B2B outreach?
Meaningfully higher than the 0.1% consumer marketing benchmark. Email spam statistics on B2B outbound specifically have found average rates closer to 2%, with a typical range of roughly 1% to 3%. That reflects the fact that recipients haven’t opted in the way a newsletter subscriber has. That context matters when a single benchmark gets applied across completely different sending types.
What’s the difference between spam complaint rate and bounce rate?
They measure different failures. Bounce rate tracks technical delivery failures, invalid addresses or full mailboxes, covered in full in our guide to acceptable email bounce rates. Spam complaint rate tracks mail that delivered successfully but was then actively reported by a human who didn’t want it. A list can have a low bounce rate and a damaging complaint rate at the same time.