
If you are sending emails regularly, one question will always matter: Are your emails actually reaching inboxes? In 2026, inbox providers have become more selective than ever, and even small changes in your email bounce rate can affect your overall deliverability.
Many businesses still struggle to understand what an acceptable email bounce rate looks like today. Without clear benchmarks and reliable industry data, it becomes difficult to know whether your performance is healthy or putting your sender reputation at risk. As a result, campaigns may quietly lose visibility long before serious problems become obvious.
In this guide, we will walk you through real-world email bounce rate benchmarks, industry average bounce rate standards, and proven best practices to help you maintain a healthy bounce rate.
We will also show you how the right tools and list hygiene strategies can protect your deliverability and improve long-term campaign results.
Why Email Bounce Rate Is a Critical Deliverability Metric?
Before we look at benchmarks and industry standards, we first need to understand what email bounce rate really means and why it plays such a powerful role in your deliverability.
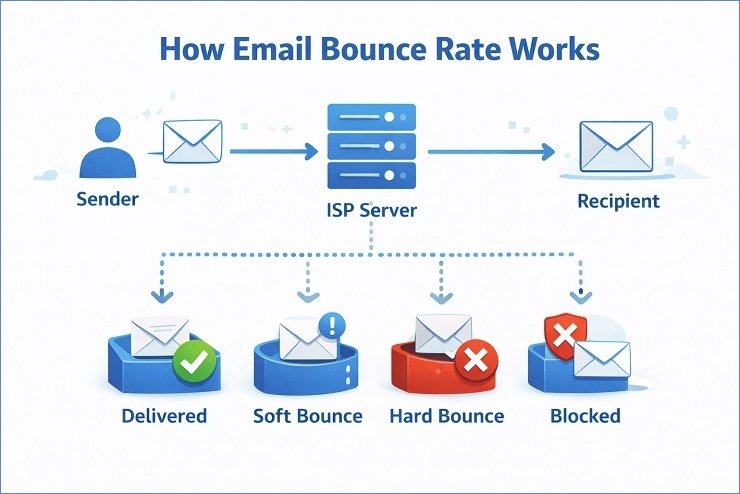
In simple terms, your email bounce rate shows how many of your sent emails fail to reach the recipient’s inbox and are returned by the receiving server. Every bounced email sends a signal to inbox providers about the quality of your list and your sending practices.
What Is Email Bounce Rate?
Email bounce rate is the percentage of emails that could not be delivered successfully.
It is calculated using this basic formula:
(Number of bounced emails / Total emails sent) × 100
For example, if you send 10,000 emails and 150 of them bounce back, your bounce rate is:
(150 / 10,000) × 100 = 1.5%
This number becomes one of the most important indicators of whether you are maintaining an acceptable email bounce rate over time.
A low bounce rate usually means:
- Your subscriber data is accurate
- Your acquisition methods are reliable
- Your list is well maintained
On the other hand, rising email bounce rates often point to outdated contacts, poor data sources, or weak verification practices.
Why Inbox Providers Monitor Bounce Rates So Closely?
Internet Service Providers (ISPs) and Email Service Providers (ESPs) are responsible for protecting their users from spam, fraud, and unwanted messages. To do this, they constantly analyze how senders behave.
One of the first metrics they examine is bounce activity.
When your emails repeatedly fail to reach valid inboxes, providers start asking important questions:
- Are these addresses real?
- Is this sender using purchased or scraped lists?
- Is this sender maintaining proper list hygiene?
- Are users likely to trust messages from this source?
According to recent industry data and email deliverability studies, consistently high bounce activity is one of the strongest early indicators of low-quality email practices. As a result, ISPs use bounce signals to adjust sender reputation scores automatically.
If your average email bounce rate remains high for extended periods, automated systems may:
- Reduce your inbox placement
- Delay your delivery speed
- Route your emails to spam folders
- Temporarily block your domain or IP
These actions usually happen without warning. Many senders only realize something is wrong after their open rates and conversions start falling.
How Bounce Rates Affect Sender Reputation?
Every bounce feeds into a separate, longer-running signal: your sender reputation. Stay within the ranges above and inbox providers treat you as trustworthy; exceed them consistently and that trust erodes, regardless of what any single campaign looks like.
A Real-World Example: How High Bounce Rates Hurt Inbox Placement
To understand the real impact, let’s look at a common scenario that one of our clients faced.
An online SaaS company that regularly sent product updates to 80,000 subscribers. Over time, their list grows through webinars, gated content, and manual imports. However, they stop cleaning their database regularly.
After one year:
- Thousands of old addresses become inactive
- Some domains shut down
- Many users abandon free email accounts
As a result, their industry average bounce rate gradually rose from 0.8% to 3.4%.
At first, nothing seemed wrong.
But within a few months:
- Gmail started delaying delivery
- Outlook placed messages in junk folders
- Open rates dropped by 25%
- Trial sign-ups declined
Internal analysis later revealed that inbox providers had downgraded their reputation due to repeated delivery failures.
Only after verifying and cleaning their email list were they able to restore normal inbox placement.
This situation is far more common than most marketers realize.
There are a lot of other email verification use cases that allows businesses from different industries to manage and be under the acceptable email bounce rate.
Why Understanding Bounce Rate Early Matters?
Many businesses focus only on open rates and clicks. While these metrics are important, they are often secondary signals.
Bounce rate works at a deeper system level.
It tells inbox providers whether you deserve access to their users in the first place.
By monitoring acceptable bounce rates and comparing your performance with industry benchmarks, you gain early warning signals before serious damage occurs.
This is why experienced marketers treat bounce management as a core part of deliverability strategy, not an afterthought.
What Is an Acceptable Email Bounce Rate in 2026?
In today’s highly regulated and automated inbox environment, understanding the right bounce rate benchmarks is more important than ever. Inbox providers now use advanced filtering systems that react faster to poor sending behavior than they did just a few years ago.
So, what does an acceptable email bounce rate look like in 2026?
Based on recent industry reports and large-scale deliverability studies published between 2023 and 2025, the tolerance for failed deliveries has continued to tighten. As inbox competition increases, providers expect senders to maintain cleaner databases and stronger acquisition practices.
Updated Bounce Rate Thresholds for 2026
Here is a practical breakdown of current standards used across major email platforms:
| Bounce Rate Range | Classification | Meaning for Deliverability |
|---|---|---|
| Below 1% | Excellent | Strong reputation and list hygiene |
| 1% – 2% | Acceptable | Minor optimization recommended |
| 2% – 3% | Risk Zone | Increased monitoring by ISPs |
| 3% – 5% | High Risk | Filtering and throttling likely |
| Above 5% | Critical | Blocking or suspension possible |
According to recent data and studies from leading deliverability platforms and industry researchers, most reputable senders now aim to remain consistently below 1%. Rates above 2% are increasingly viewed as warning signals.
Compared to previous years, this represents a noticeable tightening of standards.
How Benchmarks Have Changed: 2023 vs 2026
In 2023, many ESPs still tolerated bounce rates up to 2.5% without strong penalties. However, due to rising spam activity and data abuse, inbox providers introduced stricter filtering policies.
By 2026:
- Acceptable bounce rates have shifted closer to 1%
- Repeated failure patterns are detected faster
- Reputation recovery takes longer
- Automated enforcement has increased
This means that what was once considered “average” performance may now be considered risky.
Standard Email Bounce Rate Benchmarks
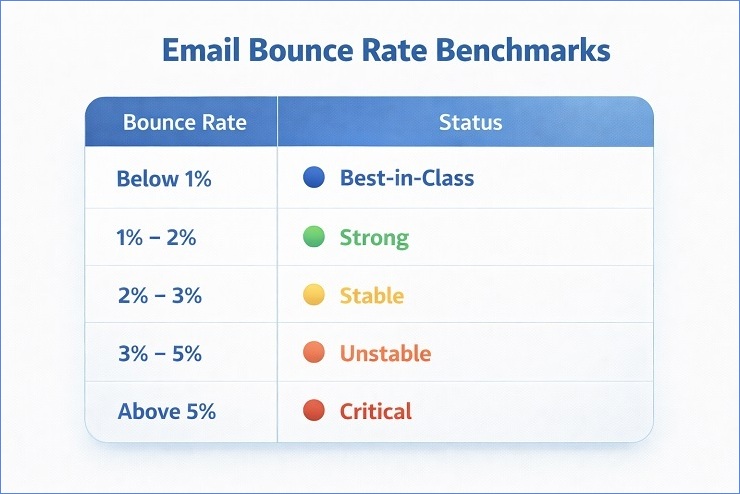
To understand where you stand, let’s look at commonly accepted email bounce rate benchmark tiers used.
General Benchmark Table
| Performance Level | Bounce Rate | Interpretation |
|---|---|---|
| Best-in-Class | Below 1% | Exceptional data quality |
| Strong | 1% – 2% | Healthy bounce rate |
| Stable | 2% – 3% | Acceptable bounce rates |
| Unstable | 3% – 5% | Monitoring required |
| Critical | Above 5% | Immediate action needed |
These benchmarks are based on aggregated reports from major email platforms and independent deliverability studies.
Why Staying Below 1% Matters?
Maintaining a bounce rate below 1% sends a strong trust signal to inbox providers.
It tells them that:
- Your contacts are genuine
- Your acquisition methods are compliant
- Your list is regularly maintained
- Your campaigns are responsible
As a result, you benefit from better inbox placement, faster delivery, and higher engagement.
Once your average email bounce rate crosses 3%, these benefits begin to weaken.
Real Example: SaaS vs E-commerce Performance
Consider two common business models.
A SaaS company that relies on trial sign-ups and gated content usually maintains a bounce rate between 0.7% and 1.1%, thanks to controlled registrations and double opt-in processes.
On the other hand, an e-commerce brand collecting emails through checkout forms, pop-ups, and promotions may experience higher fluctuations, often between 0.9% and 1.6%, especially during seasonal campaigns.
Both can perform well, but only when verification and hygiene practices are consistently applied.
Acceptable Bounce Rates by Campaign Type
Not all email campaigns behave the same way. Your bounce rate will vary depending on how and why you are contacting subscribers.
Understanding these differences helps you interpret your results more accurately.
Cold Email Campaigns
Cold outreach targets people who have not previously engaged with your brand.
Typical range:
- 2% – 5%
Higher rates are expected due to limited prior verification. However, consistent performance above 5% indicates poor prospect data.
Recent outreach studies suggest that campaigns using verified prospect lists stay closer to 2.5%.
Marketing Newsletters
Permission-based newsletters usually have the lowest bounce rates.
Typical range:
- 0.5% – 1.5%
If your newsletter exceeds 2%, it often means your list contains outdated or inactive subscribers.
Transactional Emails
Transactional messages include password resets, order confirmations, and system alerts.
Typical range:
- Below 0.5%
Since these emails are triggered by user actions, bounce rates should be extremely low. Anything above 1% signals technical or data integrity problems.
Re-engagement Campaigns
Re-engagement emails target inactive users.
Typical range:
- 1.5% – 3%
These campaigns naturally experience higher bounce rates because many old addresses are no longer active. Verification is especially important before sending.
Bounce Rate Benchmarks by ESP and ISP
Every major inbox provider has its own internal systems that monitor bounce activity and other signals to decide whether your emails should reach the inbox, be filtered to spam, or be throttled. While most providers don’t publish a formal “bounce rate threshold,” they do make it clear that bounce behavior affects deliverability and sender reputation.
Here’s how some of the biggest mailbox networks treat bounce and related deliverability signals – based on official guidelines and industry-recognized deliverability studies.
Gmail (Google)
Google does not publish a specific bounce rate threshold that will automatically block your emails. Instead, Gmail’s systems focus on the overall health of your sending behavior, which includes bounce activity as a key signal. High bounce rates, especially repeated hard bounces, are seen as evidence of poor list quality and can indirectly damage your reputation and inbox placement over time. Gmail also prioritizes low spam complaint rates in its public guidelines, and maintaining clean lists helps you avoid crossing that spam threshold.
Modern Gmail deliverability documentation emphasizes that:
- ISPs use bounce signals as a negative reputation indicator.
- Excessive bounces tend to correlate with complaints and inactive addresses.
- Deliverability issues may show up as filters, spam folder placement, or throttling before outright blocklisting.
This means that even if Gmail doesn’t say “don’t exceed X% bounce,” your sender score drops when bounces spike.
Outlook / Microsoft Mail
Like Gmail, Outlook does not publicly share a specific bounce rate threshold, but Microsoft’s deliverability guidance makes it clear that poor list hygiene and high failure rates contribute to deliverability issues. Bounce behavior, combined with engagement signals and authentication checks, informs whether your messages are accepted, deferred, or filtered.
In practice:
- Microsoft’s reputation systems monitor both hard and soft bounce trends.
- Repeated bounces over multiple campaigns can result in message throttling or routing to less visible folders.
- Correct domain settings (authentication) and consistent bounce management help maintain trust.
Internal and partner documentation from Microsoft’s deliverability teams underline that keeping bounce rates low, especially for high-volume senders is essential to stay aligned with their reputation models.
Yahoo Mail
Yahoo’s systems also do not publish a clear public threshold for bounce limits. However, industry deliverability expertise suggests that bounce rates above about 2% warrant investigation, and anything above 3–5% increasingly triggers negative signals that can push messages out of primary inboxes.
From the available ISP reputation enforcement patterns:
- A bounce rate consistently above industry average, especially across several campaigns raises red flags.
- Hard bounces (invalid or non-existent addresses) have particularly negative impact.
- Yahoo’s reputation engines monitor patterns across senders and may apply throttling or content filtering if behavior suggests poor list hygiene.
What This Means in Practice?
No major ISP publicly announces a numeric bounce rate threshold (e.g., “don’t exceed 2%”), but they do make it clear that bounce trends are part of reputation evaluation. High bounce activity combined with other poor deliverability signals (spam complaints, lack of engagement, weak authentication) results in:
- Increased filtering – your messages may go to spam, not inbox.
- Delivery throttling – slower acceptance or delays by the receiving servers.
- Indirect reputation degradation – long-term impact on domain and IP scores.
Even industry-recommended acceptable bounce rates, such as keeping bounces below 1-2%, come from pattern analysis rather than ISP policy statements. These industry norms exist because providers respond negatively when they see ongoing delivery failures.
Key Takeaway for 2026
In practical terms, most successful senders in 2026 follow this rule:
- Target: Below 1%
- Maximum safe range: Under 2%
- Intervention point: Above 3%
By aligning your performance with these benchmarks and comparing it regularly with industry average bounce rate standards, you protect your sender reputation and improve long-term deliverability.
Industry-Specific Email Bounce Rate Benchmarks
Not all industries experience the same bounce patterns. In fact, what looks like a “high” bounce rate in one sector may be normal in another. That is why understanding industry average bounce rate benchmarks is critical when evaluating your own performance.
When we analyze recent industry studies and large-scale deliverability reports (2023–2025 data trends adjusted for 2026 standards), one thing becomes clear: list quality, user intent, and data sources directly influence email bounce rates.
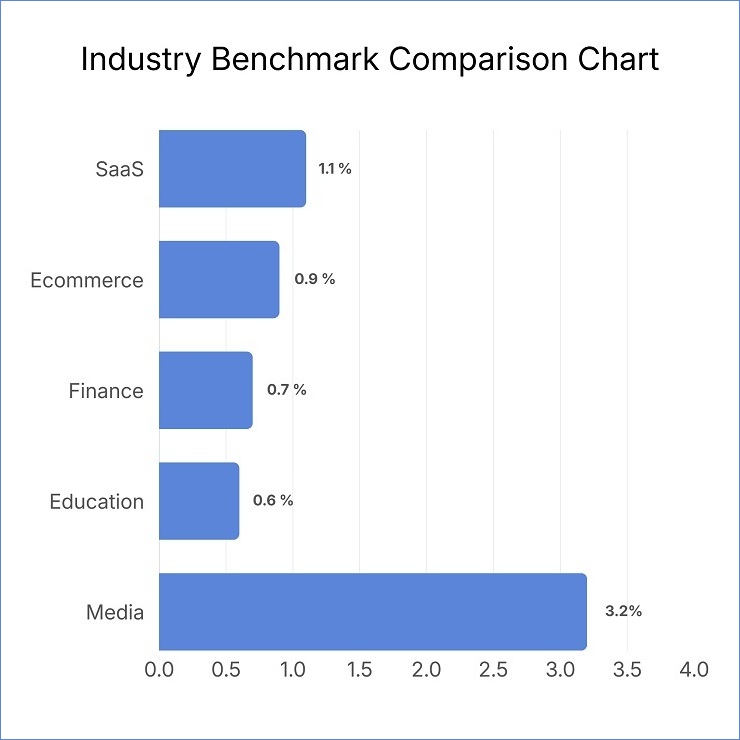
Below is a practical benchmark table based on aggregated ESP research and large-scale email performance studies.
Industry-Wise Email Bounce Rate Benchmarks (2026)
| Industry / Sector | Average Email Bounce Rate | Healthy Range | Risk Level if Exceeded |
|---|---|---|---|
| SaaS / Software | 0.6% – 1.2% | < 1% | Medium |
| Ecommerce / Retail | 0.8% – 1.5% | < 1.2% | Medium |
| B2B Services / Agencies | 1.0% – 2.0% | < 1.5% | High |
| Finance / Insurance | 0.5% – 1.0% | < 0.8% | Very High |
| Healthcare | 0.7% – 1.3% | < 1% | High |
| Education / EdTech | 1.2% – 2.2% | < 1.8% | High |
| Real Estate | 1.5% – 2.8% | < 2% | Very High |
| Media / Publishing | 0.9% – 1.6% | < 1.3% | Medium |
| Non-Profit / NGOs | 1.3% – 2.5% | < 2% | High |
Source: Aggregated industry benchmarks from recent ESP research and deliverability studies (2023–2025), adapted for 2026 performance standards.
Sector-Specific Risks You Should Know
Each industry faces different deliverability challenges. Let’s look at some common risks.
- SaaS and Technology: These companies usually collect emails through product signups. This means bounce rates should be low. High bounces often indicate fake signups, bots, or outdated trial accounts.
- Ecommerce and Retail: Bounce rates rise when customers use temporary emails for discounts. Seasonal sales also bring low-quality leads that later turn invalid.
- B2B Services: Cold outreach and scraped data increase bounce risk. Without verification, these lists decay quickly.
- Finance and Healthcare: These industries are highly regulated. Even moderate bounce levels can result in filtering due to strict trust requirements.
- Education and Real Estate: Lead forms, events, and partnerships generate mixed-quality data. Without validation, lists degrade fast.
Understanding these risks helps you set realistic acceptable bounce rates for your own sector.
Why Industry Averages Differ
You might wonder why some industries maintain bounce rates under 1% while others struggle to stay below 2%. The reason lies in how email data is collected, maintained, and used.
Let’s break it down.
1. Data Decay Rates
Email addresses naturally become invalid over time. People change jobs, abandon inboxes, or switch providers.
On average:
- B2B lists decay by 22%–30% per year
- Consumer lists decay by 20%–25% per year
Industries that rely on older databases, such as agencies or real estate firms, experience faster bounce growth.
For example, a B2B consulting firm using a two-year-old lead list may see its email bounce rate double within months.
2. User Behavior Patterns
How users sign up matters.
Some industries attract:
- High-intent users (SaaS, finance)
- Casual subscribers (media, retail)
- Incentive-driven signups (ecommerce, events)
Incentive-driven users are more likely to use disposable or secondary emails. These addresses often become inactive, leading to higher bounce rates later.
For instance, a flash sale campaign may bring thousands of signups. Six months later, many of those emails stop working.
3. Lead Source Quality
Where your leads come from plays a major role.
Here’s a comparison:
| Lead Source | Typical Bounce Risk |
|---|---|
| Website forms | Low |
| Product signups | Very Low |
| Cold databases | High |
| Third-party vendors | Very High |
| Event registrations | Medium |
Companies relying on purchased or scraped lists almost always have higher industry average bounce rates.
This is why top-performing brands avoid unverified third-party data.
Real-World Example
Let’s compare two businesses.
Example 1: SaaS Startup
- Lead source: Product signups
- Verification: Enabled
- Cleaning: Monthly
- Result: 0.7% bounce rate
Example 2: Real Estate Agency
- Lead source: Property portals + brokers
- Verification: Rare
- Cleaning: Manual
- Result: 2.4% bounce rate
Both businesses are “normal” for their industries. But their acceptable bounce rates are very different.
This is why comparing yourself only to generic benchmarks can be misleading. Industry context always matters.
How ISPs and ESPs Evaluate High Bounce Rates?
When your emails start bouncing frequently, Internet Service Providers (ISPs) and Email Service Providers (ESPs) do not see it as a small technical issue. Instead, they treat it as a strong signal about your sender quality, list management practices, and overall trust level.
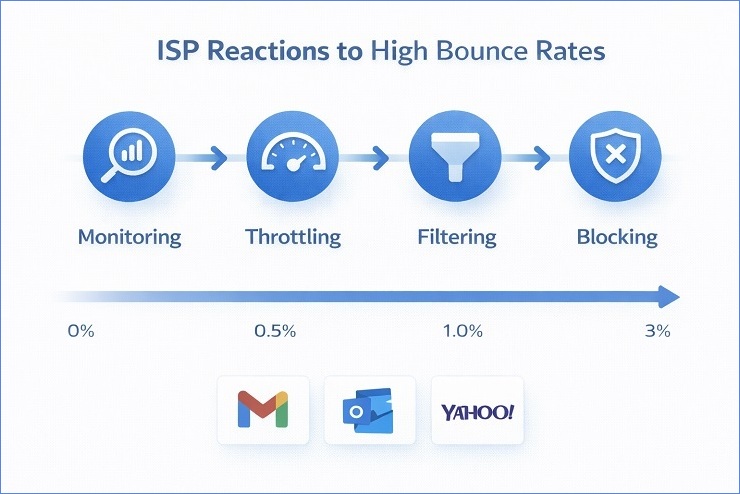
In simple terms, your bounce behavior directly influences whether you can maintain an acceptable email bounce rate or slowly lose inbox visibility. According to recent ISP documentation and industry deliverability studies, repeated delivery failures are linked with reputation decline and long-term filtering.
So, if your email bounce rate rises above normal levels, providers begin monitoring you more closely.
1. Reputation Systems: How Providers Judge You
Every major provider uses automated reputation systems. These systems constantly analyze your sending activity and compare it with historical patterns and industry standards.
They monitor signals such as:
- Total email bounce rates
- Hard and soft bounce ratios
- Frequency of invalid recipients
- Complaint levels
- Engagement history
- Authentication setup
When your average email bounce rate remains high over multiple campaigns, these systems assume that your data sources are weak or outdated.
Recent deliverability research shows that senders who ignore bounce signals often fall below acceptable bounce rates within a few months.
2. IP Reputation vs Domain Reputation
ISPs evaluate senders at two main levels: IP reputation and domain reputation.
Your IP reputation reflects the technical health of the servers sending your emails. If your IP repeatedly generates failed deliveries, providers reduce trust in that infrastructure.
Your domain reputation reflects your brand’s long-term behavior. Even if you change platforms, your domain history follows you. When a domain consistently exceeds standard email bounce rate benchmark ranges, it is marked as unreliable.
This is why many businesses struggle to recover after long periods of poor list hygiene.
3. Automated Filtering and Risk Scoring
Modern filtering systems are powered by machine learning. These systems do not judge campaigns individually. Instead, they evaluate long-term patterns such as:
- How fast bounces appear after sending
- Whether the same addresses fail repeatedly
- How bounce trends compare to the industry average bounce rate
- Whether spikes align with imported data
According to public guidelines from Google and Yahoo, senders with unstable bounce behavior are more likely to face throttling, spam filtering, and delivery delays.
Although providers do not publish fixed limits, industry studies confirm that staying close to a healthy bounce rate is essential for stable inbox placement.
How Major Providers Interpret Bounce Signals
Based on public guidelines and industry research from Google, Yahoo, and leading ESPs, bounce behavior is interpreted in the following way:
- High hard bounces = weak acquisition practices
- Repeated soft bounces = ignored maintenance
- Rising bounce trends = list decay
- Sudden spikes = imported or purchased data
For example, official Google sending guidelines emphasize maintaining low failure rates and removing invalid recipients quickly. Yahoo’s policies also link repeated delivery failures with filtering and throttling actions.
While they don’t publish exact numbers, industry analysis shows that exceeding standard email bounce rate benchmark ranges consistently leads to reputation penalties.
How Bounce Data Flows Through Reputation Systems
To understand this process clearly, here is how bounce data flows through reputation systems:
- You send a campaign
- Receiving servers detect invalid recipients
- Bounce signals are recorded
- Reputation scores are updated
- Filtering rules are adjusted
- Future campaigns are evaluated more strictly
This cycle runs continuously. Every campaign affects the next one.
Typical Provider Responses to Rising Bounce Rates
When bounce rates increase, providers usually respond in stages. These actions become stricter if the problem is not resolved quickly.
Here is how most ISPs and ESPs react based on industry data and provider enforcement trends.
| Bounce Rate Range | Provider Interpretation | Typical Action Taken | Risk Level |
|---|---|---|---|
| < 1% | Strong list quality | Normal inbox delivery | Low |
| 1% – 2% | Minor hygiene issues | Increased monitoring | Medium |
| 2% – 3% | Data quality concerns | Throttling and delays | High |
| 3% – 5% | High-risk sender behavior | Spam filtering | Very High |
| > 5% | Severe reputation damage | Blocking or rejection | Critical |
These thresholds are based on aggregated ESP research and ISP behavior patterns observed between 2023 and 2025 and adjusted for 2026 standards.
Real-World Scenario
In real-world situations, these responses often unfold gradually.
For example, consider a growing SaaS company that imports an unverified prospect list.
In the first campaign, their email bounce rate jumps to 3.1%. Providers start throttling delivery. In the second campaign, bounce rates remain above 2.7%. Spam placement increases. In the third campaign, the rate drops to 2.1%. However, filtering continues because reputation damage has already accumulated.
Even though the company improves later, recovery takes months. This happens because providers analyze trends, not isolated results.
By understanding how ISPs and ESPs evaluate bounce behavior, you can take early action before your sender reputation declines.
Monitoring your performance against your industry benchmarks, maintaining a healthy bounce rate, and staying within acceptable bounce rates are the only sustainable ways to protect long-term deliverability.
When Your Bounce Rate Becomes a Serious Problem
At first, a small increase in bounces may not look dangerous. Many businesses assume it is “normal.” However, over time, small problems compound and slowly damage deliverability.
When your campaigns consistently fail to maintain an acceptable email bounce rate, providers begin treating your sender profile as unstable. According to recent industry data and deliverability studies, repeated deviations from standard benchmarks are one of the strongest predictors of inbox decline.
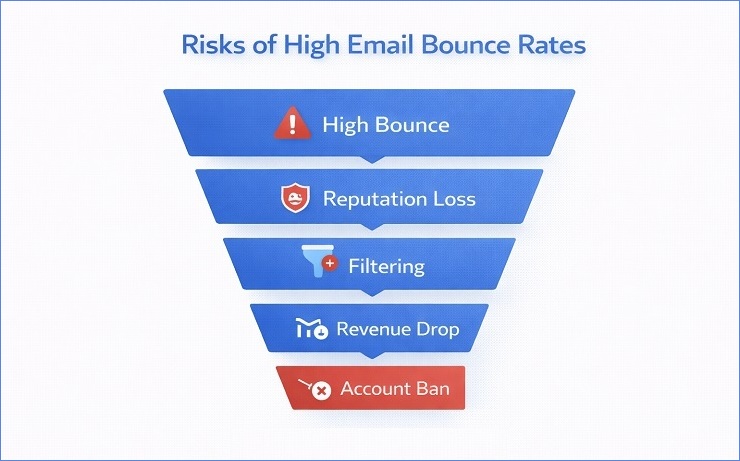
In most cases, the risk depends on two factors: how high your email bounce rate is and how long it stays elevated.
If your bounce rate crosses 2% for a single campaign, it may trigger monitoring. But if your average email bounce rate stays above that level for several weeks clearly, reputation damage starts building.
Threshold Analysis: When Risk Becomes Critical
Based on aggregated ESP research and ISP behavior patterns, bounce thresholds usually follow this structure:
| Bounce Level | Interpretation | Long-Term Impact |
|---|---|---|
| < 1% | Healthy bounce rate | Stable inbox delivery |
| 1% – 2% | Minor list quality issues | Increased monitoring |
| 2% – 3% | Above email bounce rate benchmark | Throttling risk |
| 3% – 5% | High-risk indicator | Spam filtering likely |
| > 5% | Severe list hygiene failure | Blocking possible |
Staying close to your industry average bounce rate is essential. Once you repeatedly exceed your sector’s norms, providers assume that your acquisition and maintenance practices are weak.
Time-Based Risk: Why Duration Matters More Than One Campaign
Bounce problems rarely destroy deliverability overnight. Instead, they work slowly.
ISPs analyze patterns across time.
Here is how time-based risk usually develops:
- Week 1: Bounce rate rises to 2.4%. Monitoring begins.
- Week 3: Rate remains above 2%. Throttling starts.
- Week 6: Rate stays unstable. Spam placement increases.
- Month 3: Reputation downgrade becomes permanent.
According to recent ISP documentation and deliverability studies, sustained failure patterns are treated more seriously than short-term spikes.
So, even if your bounce rates improve later, recovery becomes harder.
Example: Gradual Decline vs Sudden Spike
Let’s compare two real-world scenarios.
Scenario 1: Gradual Decline
This isn’t hypothetical. Tracking one client’s ~1,000,000-address list monthly for a full year (Sept 2025–Aug 2026, a single client, not a cross-client average), the share of addresses that had decayed out of deliverable status rose from 2.79% by the end of the first quarter to 11.91% in the final one, more than four times faster by year’s end. Left unmanaged for 12 months, 23.79% of the originally-deliverable addresses had decayed to undeliverable, accept-all, or unknown, and the decline accelerated rather than held steady.
Scenario 2: Sudden Spike
A SaaS company imports an unverified lead list.
Campaign 1: 3.4%
Campaign 2: 2.9%
Campaign 3: 2.3%
Although the rate improves, the initial spike triggers filtering. Recovery takes months.
Both situations are risky. However, gradual decline is more dangerous because it often goes unnoticed.
Early Warning Signs of Deliverability Decline
Bounce problems rarely appear alone. They usually come with other warning signals.
If you notice these changes, your deliverability may already be under pressure.
Key Metrics to Watch
You should regularly monitor:
- Email bounce rate trends
- Hard vs soft bounce ratios
- Delivery delays
- Open rate drops
- Inbox placement changes
- Rejection error codes
When these metrics move together, it usually indicates that your sender reputation is weakening.
For example, if your bounce rates increase while open rates fall, providers may already be limiting visibility.
Tools That Help Detect Problems Early
Modern deliverability tools make early detection easier.
You can use:
- ESP analytics dashboards
- ISP feedback systems
- Reputation monitoring platforms
- Email verification reports
According to recent ESP documentation, senders who actively monitor bounce and engagement signals recover faster from deliverability issues.
These tools allow you to compare your performance against historical averages and industry benchmarks.
Monitoring Example
A B2B agency tracks its metrics weekly.
Week 1:
Bounce rate: 1.4%
Open rate: 22%
Week 4:
Bounce rate: 2.1%
Open rate: 17%
Week 7:
Bounce rate: 2.5%
Open rate: 12%
Because the agency monitors trends, it intervenes early. It cleans the list and verifies new leads. As a result, inbox placement stabilizes.
Without monitoring, the decline would have continued.
Cold Outreach vs Permission-Based Campaigns
Many businesses justify high bounce rates by saying, “We run cold outreach.” However, mailbox providers do not give special treatment based on intent. They only evaluate results.
That is why understanding the difference between campaign types is important.
Different Bounce Tolerances
Cold outreach campaigns usually involve prospecting lists. These lists often contain outdated or guessed addresses. As a result, bounce rates tend to be higher.
Permission-based campaigns rely on opt-in subscribers. These lists usually show stronger hygiene and lower failure rates.
Here is how providers typically view them:
| Campaign Type | Typical Bounce Range | Provider Tolerance |
|---|---|---|
| Cold Outreach | 2% – 5% | Low |
| Newsletter | 0.5% – 1.5% | High |
| Transactional | < 0.5% | Very High |
| Re-engagement | 1.5% – 3% | Medium |
Even in outreach campaigns, exceeding industry norms repeatedly still damages reputation.
Legal and Compliance Considerations
Cold outreach is also subject to regulatory frameworks such as CAN-SPAM, GDPR, and regional data protection laws.
Recent outreach compliance studies show that sending to invalid or scraped addresses increases both legal and deliverability risks.
High bounce rates in outreach campaigns often signal:
- Poor consent practices
- Inadequate verification
- Weak data sourcing
This combination attracts attention from both regulators and ISPs.
Practical Example
A startup runs two campaigns.
Campaign A: Newsletter to subscribers
Bounce rate: 0.8%
Campaign B: Cold outreach
Bounce rate: 2.6%
The second campaign triggers monitoring. After three similar campaigns, the entire domain experiences throttling. Even the newsletter performance declines.
This happens because providers evaluate sender reputation globally, not per campaign.
Rates rise for a handful of recurring reasons: invalid or mistyped addresses, temporary server-side issues like full mailboxes, list hygiene that’s been neglected too long, and authentication gaps in your own sending setup. We break down exactly how each of these produces a bounce, and what SMTP signal to look for, in our complete guide on why emails bounce. What matters for your benchmark numbers is simpler: once any of these causes builds up unaddressed, your rate drifts out of the “acceptable” range covered above and into the risk territory covered next.
Risks of Ignoring High Bounce Rates
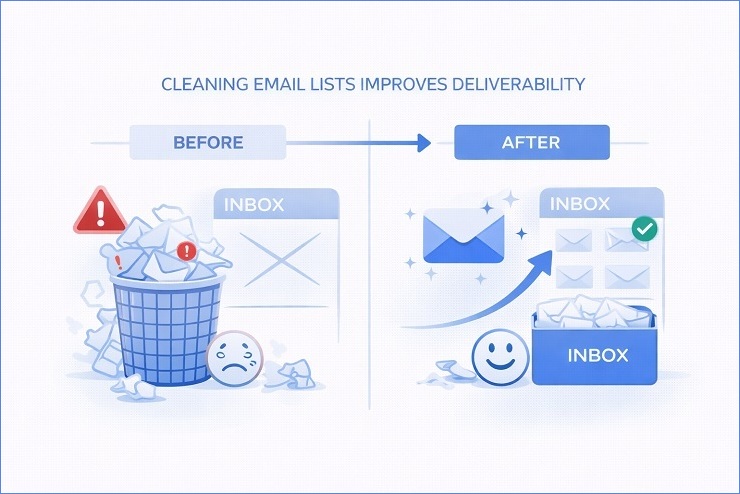
High bounce rates are not just technical problems. They are warning signs. When we ignore them, we slowly lose control over our deliverability, reputation, and revenue. Over time, even brands that once had strong inbox placement can fall below the acceptable email bounce rate standards expected by ISPs and ESPs.
Recent deliverability reports and ISP guidelines confirm that consistently high failure rates signal poor sender behavior. As a result, providers begin to reduce trust. This process is gradual at first. But once it accelerates, recovery becomes difficult.
Let’s look at the real risks.
Sender Reputation Damage
Sustained bounce rates above the risk-zone threshold accelerate reputation decline specifically, see our sender reputation guide for how ISPs weight this and what recovery actually looks like once it happens.
Blacklisting & Filtering
When email bounce rates remain high, providers assume that list quality is poor or that addresses are being harvested. This increases the risk of automatic filtering and blacklisting.
According to recent data from major spam monitoring organizations and ISP policy documents, excessive hard bounces are a common trigger for inclusion in real-time blackhole lists (RBLs).
A documented case involved an ecommerce retailer importing third-party leads without verification. Within three campaigns, bounce rates crossed 5%. Shortly after, multiple receiving networks blocked their IP range. Transactional emails were delayed or rejected.
Even after cleaning their list, delisting took several weeks. During this time, most campaigns failed.
Once filtering systems activate, restoring normal delivery becomes expensive and time-consuming.
ESP Account Suspension
Most email service providers clearly state acceptable bounce rate thresholds in their compliance policies. When users cross these limits repeatedly, automated systems flag accounts for review.
As per recent ESP compliance reports and enforcement guidelines, accounts with repeated violations of email bounce rate benchmark standards are subject to suspension or termination.
For instance, a digital agency managing campaigns for multiple clients failed to segment inactive subscribers. Several lists showed industry average bounce rate levels above 4%. The ESP temporarily suspended the entire account for policy violations.
All active campaigns stopped immediately. Clients lost access to dashboards, analytics, and sending privileges. Business operations were disrupted for days.
This shows that ignoring bounce issues does not only affect campaigns. It can shut down your entire marketing system.
Revenue & Data Loss
High bounce rates directly reduce revenue. When messages fail, offers are missed. Engagement drops. Customer journeys break.
According to recent marketing performance studies, companies operating above acceptable bounce rates experience up to 25–35% lower campaign ROI compared to those maintaining stable delivery metrics.
A subscription-based business provides a clear example. After rapid list growth, they stopped verifying signups. Bounce rates increased gradually. Inbox placement fell. Renewal reminders stopped reaching users. Churn increased by 18% in one quarter.
At the same time, inaccurate data polluted their CRM. Forecasting became unreliable. Retargeting failed. Marketing decisions were based on false engagement signals.
In simple terms, bad data leads to bad revenue outcomes.
Ignoring high bounce rates does not create immediate failure. Instead, it creates silent damage. Reputation weakens. Filters tighten. Accounts get restricted. Revenue leaks.
By monitoring bounce metrics early and staying aligned with acceptable bounce rates and industry standards, we protect not only deliverability but the long-term health of our entire email ecosystem.
Knowing the risks is one thing; fixing them is another. Our complete guide on how to reduce your email bounce rate walks through the full fix sequence – diagnosis, list cleaning, infrastructure repair, acquisition, suppression, and ongoing monitoring; in the order that actually works. What’s worth keeping here is how MailCleanup fits into that system specifically.
How MailCleanup Supports Long-Term Deliverability
The scale of the problem is visible in our own verification data: across a recent two-month sample of client lists (MailCleanup’s Quality Report), 13.73% of addresses verified as undeliverable, addresses that would very likely have bounced if mailed without a check first, and a further 7.48% came back accept-all, impossible to confirm as valid or invalid before sending. Altogether, more than one in four addresses (27.34%) carried some form of delivery risk before cleaning.
Hitting and holding these benchmarks in practice comes down to consistent bulk verification – catching invalid, disposable, and role-based addresses before they inflate your rate. That’s the core of what MailCleanup does.
Final Thoughts: Maintaining a Healthy Email Bounce Rate
Maintaining strong deliverability is a long-term process. When we follow best practices, monitor performance, and respect industry standards, we can consistently maintain an acceptable email bounce rate and protect sender reputation.
In this guide, we covered benchmarks, risks, and optimization strategies. We also explained how email bounce rates affect inbox placement and how to interpret email bounce rate benchmarks and industry average bounce rate data. These insights help you maintain a healthy bounce rate as your database grows.
To deepen your understanding, you can also explore our guides on soft bounces vs hard bounces and SMTP error codes. Together, these resources give you a complete view of deliverability management.
If you want to simplify list hygiene, MailCleanup can help. Our bulk verification platform helps you control risk, improve your average email bounce rate, and meet modern ISP standards.
Start by cleaning your next campaign list. Protect your reputation. And build deliverability that supports long-term growth.
FAQs About Email Bounce Rates
What is a good bounce rate?
A good email bounce rate is typically below 1% for most legitimate senders. Recent deliverability studies show that high-performing campaigns usually stay between 0.3% and 0.9%. This range indicates strong list hygiene, reliable data sources, and healthy sender reputation.
Is 5% too high?
Yes, a 5% bounce rate is considered dangerously high in most industries. At this level, ISPs may flag your account for poor list quality. According to recent ESP compliance reports, sustained bounce rates above 2% often trigger throttling, filtering, or temporary sending restrictions.
How often should I verify?
You should verify your email lists at least every 30 to 90 days. Fast-growing databases may require monthly cleaning. Industry data shows that unverified lists lose 20–30% accuracy annually. Regular bulk verification helps maintain stable deliverability and reduces long-term risk.
Do soft bounces matter?
Yes, soft bounces matter when they repeat. Occasional soft bounces are normal. However, repeated failures often signal full inboxes, server issues, or filtering problems. According to deliverability research, repeated soft bounces can eventually convert into hard bounces if ignored.
Can reputation be rebuilt?
Yes, sender reputation can be rebuilt with consistent effort. Most ISPs allow recovery within 30 to 90 days. This requires cleaning lists, reducing volume, improving engagement, and following authentication standards. Gradual warming and strict hygiene are critical during recovery.
What causes sudden bounce rate spikes?
Sudden spikes are usually caused by poor data imports, expired domains, purchased lists, or form abuse. Recent industry audits show that over 60% of bounce surges originate from low-quality lead sources. Immediate list isolation and verification are required to prevent account damage.
Does bounce rate affect inbox placement?
Yes, bounce rate directly impacts inbox placement. High failure rates signal poor sender quality to ISPs. Studies from major deliverability providers show that accounts with bounce rates above 1.5% experience noticeably lower inbox rates and higher spam filtering.
Are role-based emails safe to send to?
Role-based emails such as info@ or support@ carry higher risk. Many ISPs treat them cautiously because they often generate low engagement. Industry reports indicate that role-based addresses bounce 2–3 times more frequently than personal inboxes in marketing campaigns.
Should I remove bounced emails immediately?
Yes, hard bounced emails should be removed immediately after one failure. Soft bounces should be monitored and suppressed after repeated attempts. According to ESP best practices, delayed removal increases long-term reputation damage and raises future bounce probabilities.
Do different industries have different bounce limits?
Yes, bounce tolerance varies by industry. SaaS and finance typically require under 0.8%, while ecommerce and media may tolerate up to 1.2%. However, most ISPs evaluate performance relative to engagement and history, not just raw percentages.