
Search for email marketing ROI and you’ll land on the same number almost everywhere: $36 to $42 back for every $1 spent. That figure gets repeated so often it starts to sound like a guarantee, the return your email programme simply hands you. It isn’t automatic. That number describes what happens when every address on your list can actually receive the message, and your list probably doesn’t clear that bar. Most guides quoting it never say so.
We can settle the question with real numbers instead of an assumption, because we verify email lists for a living. Across 653,070 addresses we’ve verified for the past recent months, a meaningful share come back Undeliverable, Accept-All, or Unknown. A standard ROI calculation never separates these categories from the addresses actually capable of converting. Every dollar you spend reaching those addresses counts against the cost side of your formula while contributing nothing to the revenue side. That’s a structural drag on the return every guide promises you. It’s present before a single subject line gets tested or a single send gets personalized.
This guide covers the full picture: the formula, what genuinely counts as cost, and current 2026 benchmarks by industry and channel. It also covers why your campaign’s own return and your whole programme’s return answer different questions. Then it does something the calculators and statistics roundups don’t. It quantifies what a typical unverified list actually costs the return you’re trying to measure, using real verification data instead of a hypothetical example.
That means the number you calculate for your own programme starts from an honest baseline rather than an optimistic one. This is one metric inside our full breakdown of email marketing KPIs, pulled out here for its own dedicated treatment. The calculation, the benchmarks, and the list-quality connection all deserve more room than a single section in a broader guide can give them.
TL;DR on Email Marketing ROI
- Email marketing ROI measures revenue generated against total campaign cost, not just software spend, since content creation, list verification, and staff time count too.
- The most consistently cited figure, $36 returned per $1 spent, comes from Litmus and has held steady for years. It describes a wide spread, though. Over a third of companies land at or below it.
- A campaign’s own ROI and the programme’s ROI answer different questions. Treating them as the same metric leads to cutting content that’s actually working.
- MailCleanup’s own recent verification data shows that Undeliverable, Accept-All, and Unknown addresses combined make up 27.34% of a typical unverified list. This guide calls that structural drag on reported ROI the pre-send ROI leak.
- Much of the industry- and channel-specific ROI data circulating online comes from a single vendor’s own customers, not independent research. It deserves more scrutiny than it usually gets.
- List quality is the first lever worth checking, before personalization, segmentation, or testing, since it sets the ceiling those other levers can actually reach.
What Is Email Marketing ROI, and How Do You Actually Calculate It
Email marketing ROI sounds like a simple ratio, and the arithmetic really is simple. What trips people up is everything that feeds into the two numbers on either side of it. Get your cost side wrong, or blur a single campaign’s number with your whole programme’s. Either way, the ROI figure you report stops meaning what you think it means.
The Email Marketing ROI Formula, and What Actually Counts as Cost
Email marketing return on investment, ROI for short, compares what a campaign or programme earned against what it cost to run. The formula itself is one line:
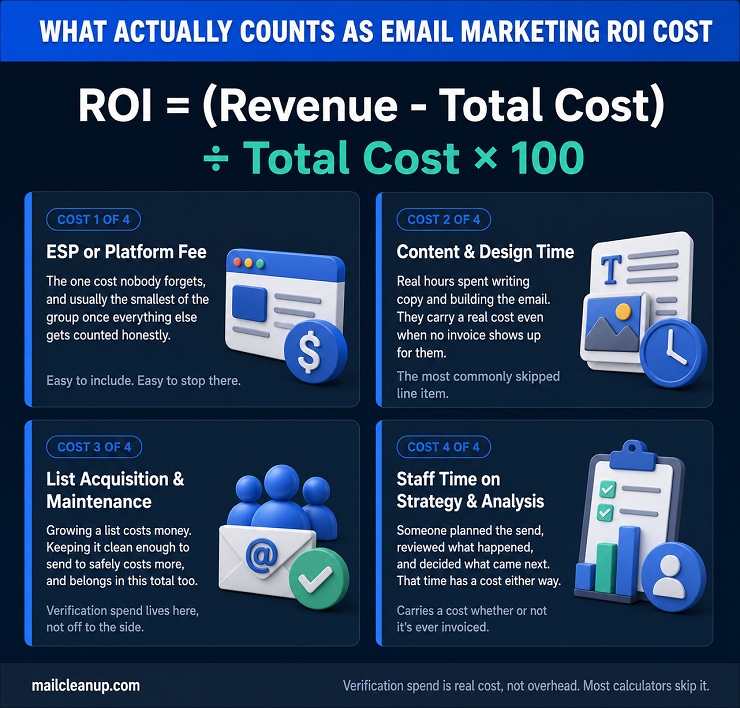
ROI = (Revenue – Total Cost) ÷ Total Cost × 100
Revenue is whatever money you can genuinely attribute to the send: sales, signups, bookings, whatever the campaign was actually built to produce. Total cost is where most calculations quietly go wrong, and not because the math is hard. Half the real costs simply never make it into the total.
A handful of guides define email marketing ROI as revenue divided by cost, with no subtraction at all. That’s a different number. Skipping the subtraction turns a return into something closer to a spend ratio. It inflates the figure in a way that looks better on a slide than it means in your actual budget meeting. The subtraction is what makes it a return in the first place. It’s money earned beyond what you spent, not just money earned per dollar spent.
Here’s what actually belongs in your cost total, and why each one is easy to leave out:
- The ESP or platform fee: the one cost nobody forgets, and usually the smallest of the group once you count the rest honestly.
- Content and design time: whoever wrote your copy and built your email spent real hours doing it. Those hours carry a real cost even when no invoice ever shows up for them.
- List acquisition and list maintenance: growing a list costs money, and keeping it clean enough to send to safely costs more. Verification spend belongs in this total, not off to the side as overhead.
- Staff time on strategy and analysis: someone planned the send, reviewed what happened, and decided what to do next. That time carries a cost whether or not it ever appears on an invoice.
Leave any of these out and your ROI figure gets easier to hit, which is exactly the problem. An email marketing ROI number that excludes half its own inputs isn’t cautious. It’s wrong in a specific, predictable direction: always too high, never too low.
The attribution trap works the other way: revenue gets over-counted almost as often as cost gets under-counted. A last-click attribution model can credit an email with a sale that was already happening anyway. Picture a customer who browsed your site that morning and added the item to a cart. If they would have bought it anyway, that purchase still counts as an email-driven conversion under this model. There’s no universal fix, since attribution windows and models vary by business. An honest email marketing ROI figure states which attribution method produced it, so whoever reads it next can actually trust the number.
Campaign-Level vs. Programme-Level Email Marketing ROI
The ROI of email marketing isn’t one number. It’s at least two, and treating them as interchangeable is where a lot of your budget decisions can go wrong.
Two different measurements answer two different questions:
- Campaign-level ROI measures one send against what that send cost you.
- Programme-level ROI measures everything your email channel earned over a period, a quarter or a year, against everything you spent running it.
A healthy number on one can sit right next to a weak number on the other without either being wrong. A welcome series is the clearest example why. Judged on its own, a welcome email’s immediate ROI often looks unremarkable: modest cost, modest direct revenue, nothing that jumps off your report. Judged as part of the programme, that same welcome series is frequently one of the strongest contributors to lifetime value. It sets the relationship’s first impression and shapes engagement for every send that follows. A campaign-level view can make a genuinely valuable email look like a candidate to cut. Only the programme-level view shows you what it’s actually worth.
The reverse happens too. Your programme can report a healthy overall email marketing ROI while individual campaigns inside it quietly lose money. A few strong performers are often just carrying the average. Without campaign-level tracking, you’ll never notice which specific sends are dragging the number down, or which ones deserve more budget.
The table below makes the split concrete: what each level actually measures, and which decisions it should drive for you.
| Campaign-Level ROI | Programme-Level ROI | |
|---|---|---|
| Measures | One send against its own cost | Every send in a period against total spend |
| Best for | Deciding what to test, cut, or repeat | Deciding whether email keeps its budget |
| Risk if used alone | Cutting genuinely valuable but low-immediate-return content | Missing which specific campaigns are underperforming |
Neither number replaces the other. Your programme only stays readable if you track both, since each one is blind to exactly what the other one sees. Getting this split right is half of what makes an email marketing return on investment figure trustworthy in the first place.
A Worked Email Marketing ROI Example
Most email marketing ROI examples use round numbers that don’t resemble a real campaign: spend $300, earn $3,000, get a clean 900% return. Your real numbers will be messier, and working through a messier example is what actually makes the formula usable for your own programme.
Here’s a realistic mid-sized promotional send, walked through step by step.
- Tally the actual costs: say your ESP fee for the send was $180. Design and copywriting time, three hours at a blended $60 hourly rate, added another $180, and verifying the 40,000-address list beforehand cost $70. One hour of strategy and reporting time added a final $60, for a total cost of $490.
- Attribute the revenue honestly: your campaign generated 118 orders at an average order value of $62, for total attributed revenue of $7,316. That figure comes from a tight 24-hour last-click window, not a looser 7-day window that would pull in purchases the campaign likely didn’t cause.
- Apply the formula: ($7,316 – $490) ÷ $490 × 100 = 1,393%, roughly $14 returned for every $1 spent.
That figure sits well below the commonly cited $36 average you’ll see everywhere, and the gap is worth sitting with rather than explaining away. A single campaign’s email marketing ROI will often land under the cross-industry figure everyone quotes. That average blends in high-performing automated flows and mature, highly segmented programmes running well above it. A number below average on one promotional send isn’t a failure on your part. It’s one data point in a programme-level average that needs more than one campaign to mean anything. That’s exactly why the previous section keeps campaign-level and programme-level ROI separate rather than collapsing them into one figure.
Email Marketing ROI Benchmarks for 2026
The formula and worked example above show you how to calculate email marketing ROI for your own programme. This section covers what to expect once you do the math. That includes the email marketing ROI benchmarks everyone cites without checking where they actually came from. Most of them deserve more scrutiny than they usually get. Few of them even agree on what email marketing return on investment actually means in the first place.
Email Marketing ROI by Industry
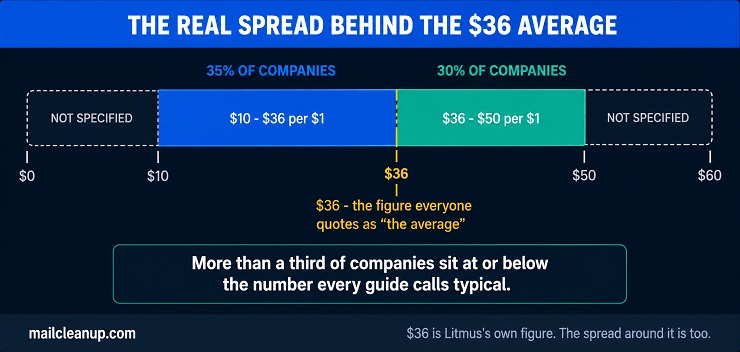
Every reliable email marketing ROI 2026 figure traces back to a small handful of primary sources. The $36-per-$1 number is the most repeated of all the email marketing ROI statistics you’ll find online. It comes from Litmus, and it has stayed remarkably consistent across their own reporting for years. Their 2023 State of Email Report, their 2024 Trends Report, and their current ROI resources all cite the same figure. That consistency is genuinely useful. You’re not chasing a number that resets every year for no reason.
What most guides leave out is that $36 was never really an average everyone hits. It’s closer to a midpoint in a wide spread. Litmus’s own breakdown shows 35% of companies land in the $10 to $36 range, and 30% land in $36 to $50. Read that carefully and you’ll notice something: more than a third of companies sit at or below the number every guide quotes as typical. If your own email marketing ROI comes in under $36, you’re not underperforming some universal standard. You’re sitting inside the range most companies actually occupy.
Industry-specific figures deserve even more scrutiny than the overall average: most of what circulates under a specific industry label isn’t independent research. It’s a platform vendor reporting results from its own customer base, dressed up as a category-wide number. Omnisend, for example, currently advertises $79 in ROI for every $1 spent on its own platform by ecommerce merchants. That’s a real, specific number, but it describes Omnisend customers using Omnisend, not the ROI of email marketing across ecommerce measured independently. The distinction matters. A platform has every incentive to report its strongest cohort. It has no obligation to show you the full spread the way a broader survey does.
None of that means industry doesn’t matter. It clearly does, just not with the false precision most tables imply. If you sell direct to consumers, you already have a sense of why. Ecommerce and retail programmes tend to outperform on email marketing ROI specifically because their purchase path is short and easy to attribute. A click leads to a cart, a cart leads to a sale, and the revenue side of the formula is straightforward to prove.
B2B programmes usually look weaker on that same campaign-level math, and not because the emails perform worse. A single send rarely closes a deal on its own. The revenue shows up later, spread across a longer sales cycle. If you’re running B2B campaigns, that’s exactly why a single quarter’s number can look unimpressive while the programme itself keeps earning its budget.
The email marketing ROI stats worth trusting are the ones that name their own methodology, not just a number. Treat the $36 figure as a reference point, not a target. Test any specific industry figure against your own historical data, not as a benchmark you’re required to hit.
How Email Marketing ROI Compares to Other Marketing Channels
Compare email marketing ROI to other channels and you’ll find two completely different kinds of data getting stacked into the same table. They get treated as if they measure the same thing. They don’t:
- Perception-based data, like HubSpot’s marketer surveys, measures which channel marketers believe performs best for them.
- Dollar-for-dollar data, like Litmus’s $36 figure, measures actual reported revenue against actual reported cost.
HubSpot surveys marketers and asks which channel they believe drives their best return, a question you’ve probably faced yourself in a budget meeting. That’s a perception measure, useful but genuinely different from a dollar-for-dollar calculation. The answer splits sharply by business type. Website, blog, and SEO efforts lead for B2B marketers, named by 27% as their top-performing channel. For B2C, the picture has actually shifted.
Email marketing topped that list in HubSpot’s 2025 report. Their most recent report shows paid social and social commerce tools pulling ahead instead. If you’ve watched your own social channels close the gap on email, the data backs that up. Email is still a strong contender there, just not the automatic top pick it used to be.
The other kind of comparison data comes from a different place entirely: it rarely says so out loud. The eye-catching cross-channel figures, SEO returning 748% or so, are usually agency-reported results from that agency’s own client base, measured over a three-year window. Email’s $36 comes from a broader marketer survey measured on a much shorter horizon. Stacking these two kinds of numbers into one ranked list makes for a tidy graphic. It compares different populations over different timeframes using different methods. Calling that a fair ranking oversells what the numbers can actually tell you.
None of this means email underperforms. The core finding holds up well across every source that actually explains its own methodology. Email remains one of the most cost-efficient channels available, since it carries no per-send media cost and reaches an audience that already opted in. What it means is that your own channel comparison is worth more than anyone else’s. Track your email marketing ROI against your other channels using the same time window and the same attribution method for all of them. You’ll get an answer nobody else’s table can give you.
Here’s every figure from this section side by side, along with what actually backs each one. Read the third column before you trust the second.
| Metric | Figure | Source & Basis |
|---|---|---|
| Overall email marketing ROI | $36 per $1 spent | Litmus, broad marketer survey, dollar-for-dollar |
| Typical spread around that average | $10-$36 for 35% of companies, $36-$50 for 30% | Litmus, same survey |
| Ecommerce ROI on Omnisend specifically | $79 per $1 spent | Omnisend, self-reported, its own platform customers only |
| Top ROI channel, B2B | Website, blog, and SEO, named by 27% | HubSpot, marketer perception survey |
| Top ROI channel, B2C | Email led in 2025, paid social and social commerce lead in 2026 | HubSpot, marketer perception survey |
| SEO ROI often compared to email’s | Roughly 748% over three years | First Page Sage, agency’s own clients, three-year horizon |
Only two of these six rows measure the same thing the same way. That’s not a flaw in the data. It’s the reason a single ranked list of “ROI by channel” oversimplifies something that was never one measurement to begin with.
The Pre-Send Email Marketing ROI Leak: What Your List Is Costing You
Every calculation of email marketing ROI asks the same question: how much did this cost, and how much did it earn back? What the formula never asks is a prior question that decides the answer before a single email even opens. How much of that cost went toward addresses that were never going to earn anything back at all?
Call it the pre-send ROI leak. It’s decided before deliverability, subject lines, or personalization get a chance to matter at all. That’s the part of your email marketing return on investment nobody accounts for. MailCleanup’s own verification data can finally put a real number on it.
How Each Address Type Erodes Your Email Marketing ROI
MailCleanup’s own email marketing ROI statistics start somewhere most guides never look. Not at what a campaign earned, but at what portion of your list could never have earned anything in the first place. Every list breaks down into a few structural categories, and each one erodes your email marketing ROI through a different mechanism.
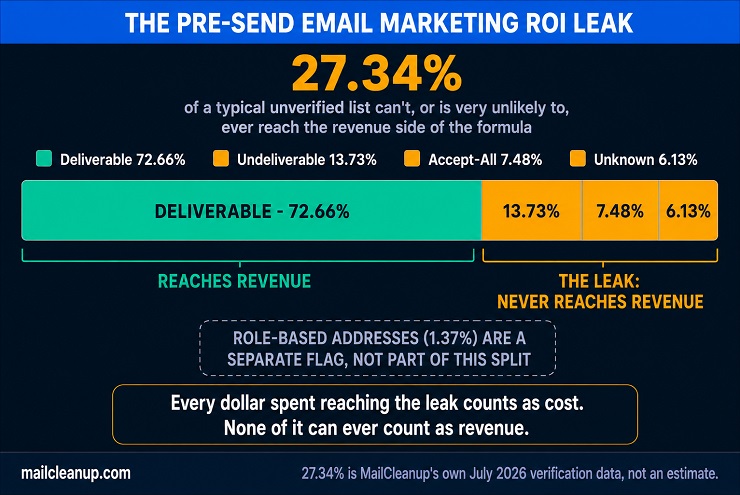
- Undeliverable addresses cost you twice: the first cost is direct. You pay to reach an address that can never open, click, or buy. Either the mailbox doesn’t exist, or the domain can’t receive mail at all. The second cost compounds the first. Hard bounces damage your sender reputation, and a damaged reputation can push otherwise-healthy sends to the spam folder for addresses that would have converted. Our deeper breakdown of what bounces actually cost walks through this compounding effect in full.
- Accept-all domains erase your certainty, not just your revenue: a domain configured to accept all mail returns a “delivered” signal. That signal appears regardless of whether the specific mailbox exists. You get no reliable confirmation a real person ever saw your message, and no dependable open or click data either. The cost is real. The odds of it converting are close enough to zero. Treating it as a live prospect in your ROI math overstates what your list can actually do.
- Unknown addresses carry risk without carrying blame: these are addresses verification couldn’t confidently resolve either way. Often, the receiving mail server simply didn’t respond during the check. Some of them are genuinely fine for you to keep sending to. Enough of them aren’t that sending to the whole category without discretion is a bet, not a strategy. Every dollar you spend reaching them stakes real money on an outcome nobody can currently predict.
The three categories above all partition your list against confirmed deliverable addresses. This is the ROI of email marketing nobody quantifies before you do. Role-based addresses measure something different, and are worth separating out clearly: inboxes like info@ or support@ are usually still deliverable. The issue isn’t whether the mail arrives. It’s who reads it. A shared team inbox rarely converts the way an individual decision-maker does. Marketing content addressed to nobody in particular gets filtered, forwarded, or ignored more often than it gets acted on. Our full explanation of what verification actually checks for covers how each category gets identified before it reaches your own report.
What This Means for Your Real Email Marketing ROI
Go back to the worked example from earlier in this guide. It used a 40,000-address list, a $490 total cost, $7,316 in attributed revenue, and a calculated email marketing ROI of 1,393%. That example never asked what the list itself was made of, the same way yours probably hasn’t either. Here’s what changes when it does.
Apply MailCleanup’s own recent composition rate, verified across 653,070 addresses, to that same list, and you get a very different picture. Undeliverable, Accept-All, and Unknown addresses combined account for 27.34% of a typical unverified list, likely including yours. On a 40,000-address list, that’s roughly 10,936 addresses structurally unable, or very unlikely, to ever land on the revenue side of the formula.
The ESP fee in that worked example was $180, and your own ESP pricing is probably scaled by list size or contact count too. Apply that same 27.34% to the fee. Roughly $49 of it was effectively spent maintaining sending capacity for addresses that could never contribute a cent of that $7,316 in revenue. Strip that dead weight out and the calculation changes.
| Original (Full List) | Adjusted (Dead Weight Removed) | |
|---|---|---|
| Cost | $490 | $441 |
| Revenue | $7,316 | $7,316 |
| Email Marketing ROI | 1,393% | 1,559% |
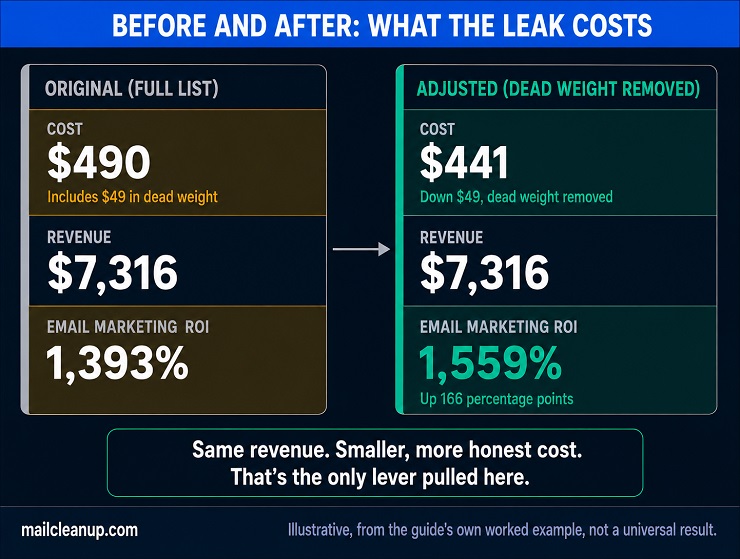
Two things this calculation is not. It’s not a claim that verifying this exact list would produce exactly 1,559%. Your real proportion depends on your own list’s own composition, not a rate borrowed from an aggregate and applied here for illustration. It’s also not the complete picture, since it isolates only the ESP-fee line from the four-part cost total in the earlier example. It leaves out deliverability, sender reputation, and the open and click rates of the addresses that do reach real inboxes.
What it does show, honestly, is the mechanism. Any list-size-driven cost you pay against addresses that can’t or are very unlikely to convert is arithmetically identical to inflating your own cost denominator. A smaller, more honest denominator is the one lever in the ROI formula you can pull without earning a single additional dollar of revenue. That’s exactly why it’s worth pulling before you touch subject lines, segmentation, or send frequency. This is what an honest email marketing return on investment calculation looks like once the list itself gets counted. Our full 2026 verification dataset breaks this composition down further, by address type and what typically drives each one.
How to Actually Improve Your Email Marketing ROI
Improving the ROI of email marketing usually starts with a list of tactics: personalize more, segment better, test everything. Each one genuinely works. Here’s what most guides skip: none of them work as well as they should while the pre-send leak from the previous section stays open. Fixing your email marketing ROI at the source changes how well every other tactic performs on top of it.
Why List Quality Comes Before Any Other Email Marketing ROI Lever
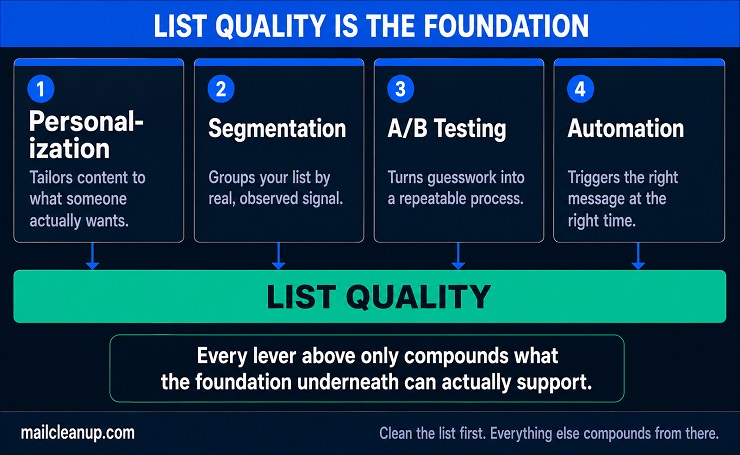
List quality isn’t one tactic among many. It’s the foundation the other tactics get measured against. When that foundation has real cracks in it, the tactics built on top of it inherit the problem in three distinct ways.
Testing gets noisier, not just less accurate: an A/B test works by comparing two groups and measuring the difference between them. An Undeliverable or Accept-All address contributes a “no open” result to whichever variant it happened to land in. The message never had a real chance to be seen, no matter which subject line or content would have actually won someone over. Spread that noise across both variants and the true difference between your winning and losing version gets harder to detect. The email marketing ROI stats your test produces still look precise. They’re measuring a smaller, messier signal than the report implies. You’ll need a bigger sample or a longer test to trust the same result.
Segmentation runs out of real signal to segment on: the whole premise is grouping people by what they’ve actually done, opened, clicked, or purchased. Accept-All and Unknown addresses carry almost none of that signal. You can’t confirm the message ever reached a real inbox in the first place. Segmenting them anyway means sorting a meaningful share of your list by a coin flip dressed up as a data-driven decision.
Personalization works from data that may not describe anyone anymore: personalization typically pulls from past behavior or purchase history tied to a specific address. If that address itself is uncertain, so is everything built on top of it. You could be tailoring a message with real care for someone who stopped checking that inbox months ago. Or they never controlled it in the first place.
None of this means skip the other tactics. It means sequence them for the sake of your own email marketing ROI. The ROI of email marketing compounds when the levers stack in the right order, list quality first, everything else after. Clean the list first. Personalization, segmentation, and testing all start measuring something real, instead of measuring around addresses that were never going to respond either way. Ongoing list hygiene is what keeps that foundation solid between verification passes, not a single cleanup done once and forgotten.
Personalization, Segmentation, and Testing: The Levers That Compound Email Marketing ROI
Once your list is clean, these are the levers that compound your email marketing ROI on top of that foundation. They’re the difference between the low end of the email marketing ROI benchmarks from earlier in this guide, and the high end. Each one has a full guide of its own; this is the short version.
- Personalization raises engagement by tailoring content to what a specific person actually wants, not just their first name in a subject line. Our full personalization guide covers all four levels, from surface-level tokens through predictive, AI-driven content.
- Segmentation groups your list by real signal, declared preferences, observed behavior, or purchase history, so each group gets content actually relevant to them. Our full segmentation guide walks through six proven types and when to use each.
- A/B testing turns guesswork into a repeatable process for improving subject lines, content, and offers over time. That only holds if the list underneath it is clean enough for the results to mean something. Our full A/B testing guide covers what to test first and what quietly corrupts results.
- Automation extends all three by triggering the right message at the right moment without manual effort. Triggers built on stale data carry their own deliverability risk, though. Our full automation guide covers that risk directly, along with workflow design.
Each lever compounds the others. None of them compounds a dirty list into anything but a bigger version of the same problem.
Your Next Step: Verify the List Behind Your Email Marketing ROI
The ROI of email marketing only means something when it’s measured against an honest baseline. This guide has walked through the formula, current email marketing ROI 2026 benchmarks, and the pre-send leak most calculations miss entirely. Every number in it, the $36 average, the 27.34% composition rate, the 1,393% worked example, is a reference point. None of it is a prediction about your own programme. The one figure that actually matters for your email marketing ROI is the composition of your own list. That’s the one number nobody outside your own data can hand you.
Before you touch subject lines, segmentation, or automation triggers, run your own list through verification. See what your actual Undeliverable, Accept-All, and Unknown share looks like. It might sit well under the 27.34% used in this guide’s illustration. It might sit well over it. Either way, you’ll be optimizing every other lever against a real number instead of an assumption borrowed from someone else’s data. That’s the same standard this entire guide has tried to hold itself to.
Verify your list before your next send. Let every email marketing return on investment figure you calculate after that start from an honest baseline.
FAQs on Email Marketing ROI
What is a good email marketing ROI?
A good email marketing ROI depends more on your own history than any external benchmark. Litmus’s own data shows 35% of companies land between $10 and $36 per $1 spent, and 30% land between $36 and $50. If you’re improving on your past performance with a clean, verified list, your ROI is good, regardless of anyone else’s average.
How do you calculate email marketing ROI?
Subtract your total cost from the revenue you can genuinely attribute to email, divide that by the total cost, and multiply by 100. The formula is ROI = (Revenue − Total Cost) ÷ Total Cost × 100. Total cost should include the ESP fee, design and copywriting time, and list verification. It also includes staff time on strategy and reporting, not just the software subscription.
What counts as a cost in email marketing ROI?
Total cost includes more than the ESP subscription. It should count design and copywriting time, list verification spend, and staff time on strategy and reporting. Each is priced at its real cost even without an invoice. Skipping any of these makes the ROI figure easier to hit, in a direction that’s always too high, never too low.
What is the average ROI for email marketing?
The most consistently cited figure, from Litmus’s own ongoing research, is $36 returned for every $1 spent. That number has held steady across their reporting since at least 2023. That figure describes an average across a wide spread, not a fixed target. Treat it as a reference point for your own results, not a number you’re expected to match exactly.
Which industry gets the highest email marketing ROI?
Ecommerce and retail programmes tend to report the strongest email marketing ROI, since a click-to-cart-to-sale path is short and easy to attribute. B2B programmes often look weaker by the same campaign-level math, mainly because a single send rarely closes a longer sales cycle on its own. Treat industry figures as directional, since many are self-reported by a single platform’s own customers, not independent research.
How does email marketing ROI compare to other channels?
Comparing email marketing ROI to other channels means comparing two different kinds of data. HubSpot’s channel rankings measure which channel marketers believe performs best, a perception survey. Litmus’s $36 figure is an actual dollar-for-dollar calculation. Email consistently ranks as one of the most cost-efficient channels either way. It carries no per-send media cost and reaches an already opted-in audience.
Does list quality affect email marketing ROI?
Yes, directly, and before any other factor gets a chance to matter. MailCleanup’s own recent verification data shows Undeliverable, Accept-All, and Unknown addresses combined make up 27.34% of a typical unverified list. Those addresses structurally can’t, or are very unlikely to, ever generate revenue, while still counting fully against your cost. That drags down the ROI figure before a single email even sends.
Does email automation improve email marketing ROI?
Automation improves email marketing ROI by triggering the right message at the right moment without manual effort. That typically raises engagement across welcome series, abandoned cart flows, and re-engagement sends. That improvement depends on the trigger firing against a real, reachable address. Automation built on stale or unverified data inherits the same deliverability risk as any other send.