
A/B testing in email marketing is the closest thing we have to a controlled experiment in a channel built on variables. You isolate one element, run it against a control, and let your audience’s behaviour tell you what works.
In theory, every test advances your programme. In practice, most email A/B testing produces far less reliable signal than the marketers running the tests believe, and the reasons have nothing to do with creative quality or strategic thinking.
This guide addresses two questions that most A/B testing resources skip entirely: what should you test first given where your campaign metrics are actually underperforming, and what is making your current results less reliable than they appear?
We cover the complete mechanism of email A/B testing, introduce The Email A/B Testing Priority Stack to guide your sequencing decisions, and examine the three sources of corrupted test data that sit between you and a result you can genuinely trust.
TL;DR on Email A/B Testing
- Email A/B testing sends two versions of the same email to separate audience segments to determine which performs better on a single measurable goal.
- A/B testing and multivariate testing are not interchangeable: A/B testing isolates one variable; multivariate testing examines several simultaneously and requires a substantially larger list to produce reliable results.
- Open-rate-based subject line A/B testing is unreliable for any list with a significant proportion of Apple Mail users, because Mail Privacy Protection pre-loads tracking pixels regardless of whether the email was actually read.
- A dirty list corrupts your A/B test results before the test starts: invalid and undeliverable addresses inflate both variants’ denominators and make every apparent winner a function of list composition, not copy quality.
- The Email A/B Testing Priority Stack guides you to the right test level based on which metric is underperforming in your campaign data, not which element is easiest to change.
- Individual A/B test wins are only as useful as the learning system you build around them; an undocumented test result is wasted audience exposure.
- Triggered and automated emails are higher-leverage A/B testing targets than broadcast campaigns because every improvement compounds across every future send in that sequence.
- Your minimum viable sample size depends on your current baseline metric, the effect size you are trying to detect, and your required confidence level; it is not a fixed number.
What Email A/B Testing Actually Means
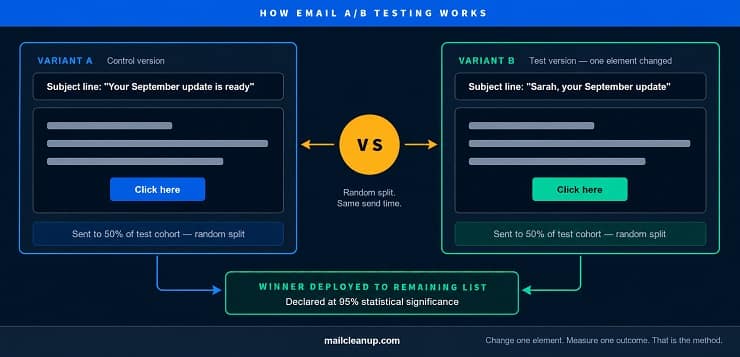
What is A/B testing in email marketing at its core? Email A/B testing is the practice of sending two versions of the same email, each with a single element changed, to two randomly divided segments of your list. The variant that performs better against a predefined metric becomes the winner. That winner is sent to the remainder of your list immediately, or its lesson is carried forward to shape future campaigns.
The structural requirement that gives email marketing A/B testing its validity is isolation. You change one thing, you measure one outcome, and the difference between the two results tells you something specific about how your audience responded to that one change. Change more than one element and you lose the ability to attribute the result to anything in particular. The test becomes an observation rather than an experiment.
Email is well-suited to A/B testing because the responses it generates are binary and cleanly trackable. A subscriber opens the email or they do not. They click a link or they do not. That clean binary output reduces the measurement noise that complicates web-based experimentation, where a visitor can take dozens of actions before leaving a page.
How Email A/B Testing Works in Practice
A valid email A/B test follows six steps in order:
- Identify your metric gap – Pull your last three to five campaign sends and identify which metric is furthest below your benchmark. This tells you where the leverage sits before you choose a variable.
- Choose one variable to test – Subject line, from name, CTA button text, copy length, image treatment, or send time. One variable per test, without exception.
- Write a falsifiable hypothesis – For example: “Adding the subscriber’s first name to the subject line will increase open rate by at least 5%, because our historical data shows higher engagement from personally addressed sends.” A hypothesis that cannot be falsified is not a hypothesis; it is a preference.
- Split your audience randomly – Divide the test cohort into equal, random halves. Hand-selecting groups introduces selection bias that makes the result ungeneralisable.
- Send both variants simultaneously – Same day, same time. Staggered sends expose the test to temporal variables, such as mid-week engagement patterns, that have nothing to do with the element being tested.
- Wait for statistical significance before declaring a winner – Most tests need a minimum of 48 to 72 hours. What statistical significance means and how to calculate it correctly is covered in H2 2.
The single-variable rule deserves more emphasis than a bullet point. Testing multiple elements simultaneously makes it structurally impossible to isolate what drove the result. This is not a stylistic guideline. It is the requirement that gives the test any meaning at all.
Email A/B Testing vs. Multivariate Testing: When Each Applies
These are not two versions of the same approach. They answer different questions and require fundamentally different audience sizes.
| A/B Testing | Multivariate Testing | |
|---|---|---|
| Variables tested | One | Multiple simultaneously |
| Audience size required | 1,000+ per variant | 10,000+ (typically) |
| What it reveals | The isolated effect of one change | How combinations of changes interact |
| Best use case | Most campaigns; most list sizes | Large lists with high send volume |
| Time to reliable result | 48 to 72 hours minimum | Longer; grows with element count |
| Risk on undersized lists | Low | High: results become noise, not signal |
For the majority of email marketing programmes, email A/B testing is the right tool. Multivariate testing is genuinely valuable when you need to understand how changes interact rather than how each performs in isolation, but it requires an audience that can support the sample demands of multiple variants running simultaneously. Running multivariate tests on a list that cannot meet that threshold produces results you will misread as meaningful.
Why Email A/B Testing Results Are Unreliable More Often Than Marketers Expect
We place this section second because it is the most practically important content in this guide. Most A/B testing resources treat data reliability as a footnote, buried after the best practices section. We treat it as the foundation, because the sequence matters.
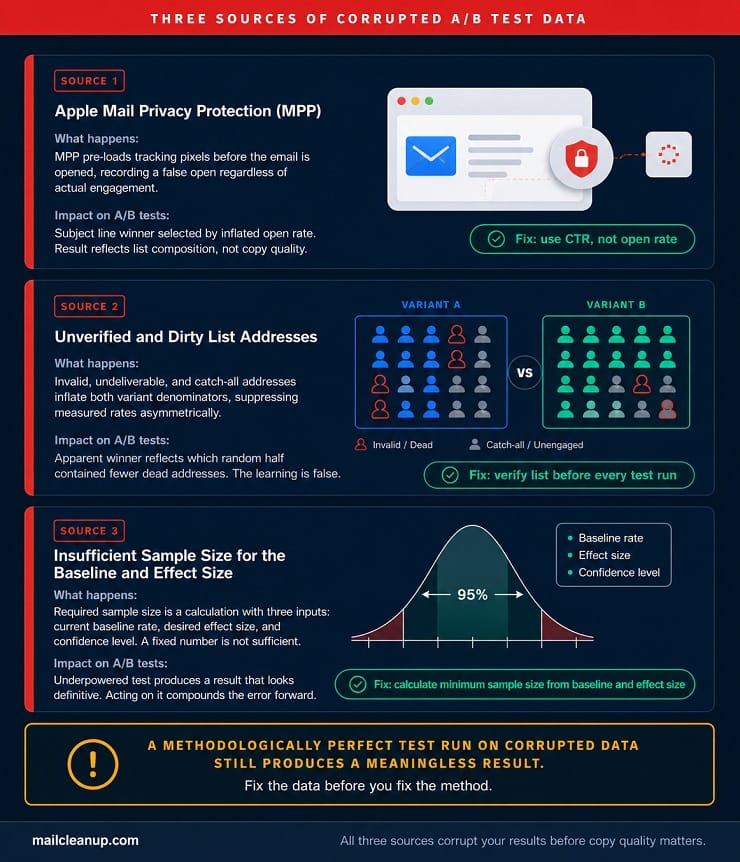
Running email A/B testing on corrupted data does not produce a neutral result. It produces a false one. You will identify a winner, apply it to future campaigns, and compound the error forward across every subsequent send. The three causes of corrupted test data below account for the majority of A/B test results that appear definitive but are not.
The Open Rate Problem: What Apple Mail Privacy Protection Does to Email A/B Testing
Subject line testing is the most common application of email A/B testing. The metric almost universally used to determine the winning variant is open rate. This is where the problem begins.
Apple Mail Privacy Protection (MPP), introduced in 2021 and expanded across iOS, iPadOS, and macOS, works by pre-loading email tracking pixels before the subscriber ever opens the message. Every Apple Mail user with MPP enabled is recorded as an open regardless of whether they actually read the email. With Apple Mail accounting for a substantial share of email opens across most consumer lists, your reported open rate includes a significant proportion of pre-loaded false positives.
The direct consequence for A/B testing: if you select a subject line winner based on open rate, and a meaningful proportion of your list uses Apple Mail with MPP enabled, you are not selecting the subject line that drove more genuine reads. You are selecting the variant whose randomly assigned sample happened to contain a slightly different distribution of Apple Mail users. That is noise, not signal. Acting on it does not improve your subject line strategy. It introduces a directional error that compounds with every subsequent test that uses the same flawed metric.
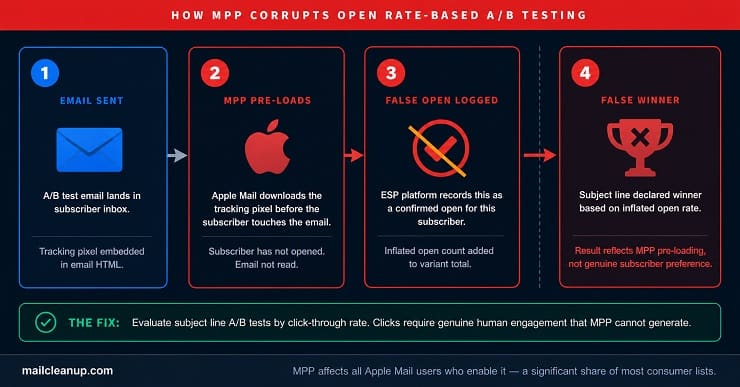
The practical adjustment is straightforward: measure subject line test results by click-through rate rather than open rate. Clicks require genuine human engagement that no privacy protection pre-loading can generate. If your testing platform selects winners automatically on open rate, override that setting or segment your Apple Mail users out of the test cohort before running.
Open rate remains a useful directional indicator for general campaign health. It should not be used as the deciding metric for subject line A/B tests without this caveat applied every time.
How List Quality Corrupts A/B Testing for Email Before the First Send
A clean, verified list is the prerequisite for valid email A/B test data. This is the point that no major testing guide addresses, and it is the most direct way a programme can generate consistently misleading results without anyone identifying why.
When you split your list into two halves for an A/B test, any invalid addresses, undeliverable addresses, and non-engaged catch-all addresses are distributed across both groups. These addresses suppress measured engagement rates for both variants equally, but not identically, because random splits are not perfectly symmetrical at the address composition level.
If variant A’s sample contains a higher concentration of catch-all or dead addresses, variant A’s engagement metrics will be systematically depressed regardless of how strong the content is. Variant B appears to win. You apply variant B’s approach to the next campaign. The real variable was list composition, not copy quality. The learning was false, and you have now built future tests on a false baseline.
The specific ways a dirty list corrupts both variants simultaneously:
- Invalid addresses generate hard bounces that damage your email sender reputation, reducing inbox placement rates for the entire send, including both test variants
- Catch-all addresses that never engage inflate the denominator for each variant without contributing positive engagement signals, suppressing both measured rates proportionally but not identically
- Undeliverable addresses mean your effective sample sizes are smaller than your split percentages suggest, potentially pushing both variants below the statistical significance threshold you need to act on the result
- Previously valid addresses that have become inactive contribute unpredictable engagement patterns that add noise to click and open data without reflecting any genuine preference
We cover the practical process for verifying your list before A/B testing in the dedicated section later in this guide. The principle is non-negotiable: no test result is more reliable than the quality of the data it was run on.
The Sample Size Problem in Email A/B Testing Nobody Explains Properly
The number 1,000 per variant appears in nearly every email A/B testing guide. It is not wrong as a minimum floor. It is misleading as a standalone figure, because it implies sample size is a universal constant when it is actually a calculation that depends on three variables specific to your campaign.
The three factors that determine whether your sample size is sufficient to trust the result:
- Your current baseline metric. The rate you are already achieving for the metric you want to improve. A list with a 40% open rate requires a substantially larger sample to detect a meaningful improvement than a list at 18%, because the statistical headroom for detecting a real difference is compressed at higher baselines.
- The minimum effect size you consider worth acting on. A 2 percentage point improvement requires a much larger sample than a 10 percentage point improvement to reach the same confidence level.
- Your required confidence level. Standard practice is 95%. Reducing this to 90% lowers sample size requirements but increases your probability of acting on a false positive.
The practical reference point:
| Baseline open rate | Minimum detectable improvement | Approx. sample size needed per variant (95% confidence) |
|---|---|---|
| 18% | 2 percentage points | ~8,500 |
| 18% | 5 percentage points | ~1,400 |
| 40% | 2 percentage points | ~15,000 |
| 40% | 5 percentage points | ~2,400 |
If your list cannot support the required sample size for the effect size you want to detect, you have two honest options: accept a lower confidence level and treat the result as directional rather than definitive, or run consistent tests across multiple campaign sends and pool the results before drawing conclusions. Declaring a winner from an underpowered test and building future campaigns on it is not testing. It is guessing with extra steps.
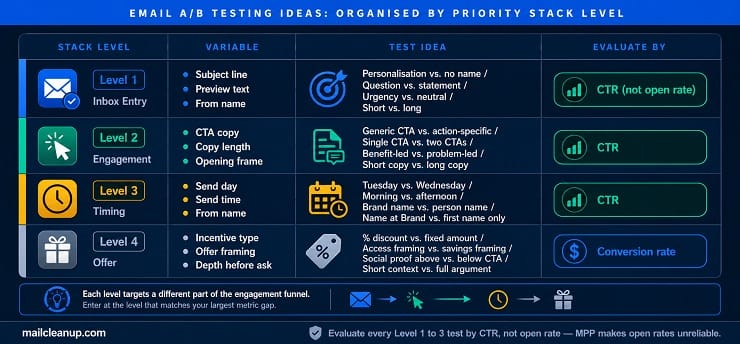
What to A/B Test First: The Email A/B Testing Priority Stack
The most common question in email A/B testing is where to start. The least useful answer, which most guides provide, is a flat list of everything you could theoretically test. That list has no diagnostic logic. It does not tell you where the highest leverage sits for your specific programme right now.
The Email A/B Testing Priority Stack organises your testing focus into four levels, each corresponding to a different stage of the email engagement funnel. The framework’s core principle: you enter the stack at the level that matches your current metric gap, not at Level 1 by default. Testing subject lines when your open rates are already performing well is a low-leverage decision. Testing offer framing when your subscribers are not even opening the email is even lower.
Before using the stack, pull your email marketing KPIs from your last three to five sends. Identify the metric that shows the largest gap against your benchmark. That gap is your entry point into the stack.
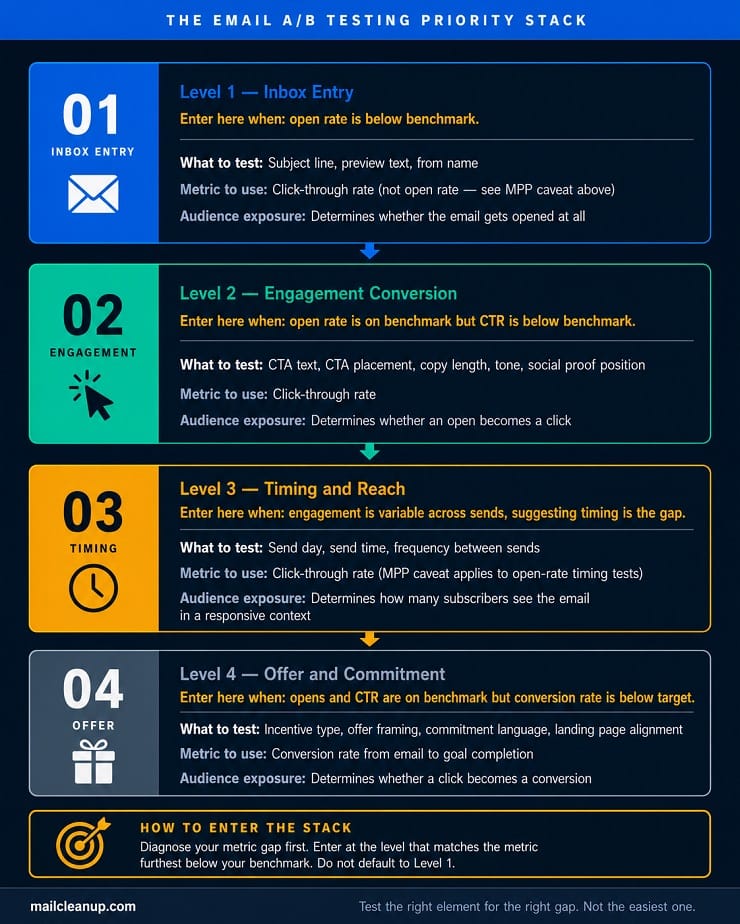
Level 1 – Inbox Entry: Where to Start Email A/B Testing
Enter Level 1 when your open rate is below benchmark.
Level 1 covers the three elements a subscriber processes before opening your email: the subject line, the preview text, and the from name. These are the only variables that affect the open decision. Everything inside your email is invisible until the subscriber chooses to open it.
Subject lines attract the highest testing frequency for a legitimate reason: small changes in personalisation, length, tone, and urgency framing can produce measurable shifts in open engagement. Hold the MPP caveat close throughout: measure subject line test results by click-through rate rather than open rate if a significant proportion of your list uses Apple Mail.
Level 1 elements to test, ordered by typical impact:
- Subject line personalisation: first name vs. no personalisation
- Subject line length: short and direct vs. longer and descriptive
- Urgency framing: time-bound language vs. no time reference
- Format: question vs. statement
- Preview text: standalone value driver vs. continuation of the subject line
- From name: brand name vs. individual name vs. “Name at Brand” format
Level 2 – Engagement Conversion: Email A/B Testing Ideas for CTAs and Copy
Enter Level 2 when your open rate is on benchmark but click-through rate is underperforming.
The subscriber opened. They are reading. Level 2 tests whether the content and the call to action are compelling enough to produce a click. This is where email A/B testing ideas generate the most direct lift against CTR.
Level 2 elements that move the needle most reliably:
- CTA button text: “Get started” vs. “Start your free clean” vs. “See what we would remove”
- CTA placement: above the fold vs. after a content block
- Single CTA vs. two CTAs in the same email
- Copy length: short and punchy vs. fuller context before the ask
- Opening frame: benefit-led vs. problem-led
- Personalised copy (dynamic content) vs. generic copy
Level 3 – Timing and Reach: A/B Testing for Email Send Time and Frequency
Enter Level 3 when your engagement metrics are reasonable but inconsistent across sends, suggesting timing is affecting how many subscribers see the email in a responsive context.
A/B testing for email send time is one of the most recommended tests in the industry, and one of the most frequently misinterpreted. Published benchmarks suggest Tuesday and Wednesday mornings perform well across many lists. Your list may behave entirely differently depending on audience profile, industry, and geography. Your own data is the only reliable source.
What send time testing specifically reveals:
- The day of week that produces the strongest click and open performance for your audience composition
- Whether morning, afternoon, or evening reaches your subscribers at a more responsive moment
- How B2B-dominant segments and consumer-dominant segments in the same list differ in timing response
The Apple Mail Privacy Protection problem applies here as well. If you use open rate to determine the winning send time, the pre-loading distortion from H2 2 still applies. Use click-through rate as your timing test metric.
Level 4 – Offer and Commitment: A/B Testing Email Campaigns for Conversion
Enter Level 4 when opens and clicks are on benchmark but your conversion rate from email to goal completion is underperforming.
Level 4 is where A/B testing email campaigns connects directly to revenue outcomes. You are no longer testing engagement signals. You are testing whether the offer itself, the framing of the commitment, and the alignment between your email promise and your landing page experience are sufficient to produce the downstream action.
Level 4 elements to test:
- Incentive type: percentage discount vs. fixed amount vs. value-add or free feature
- Offer framing: savings emphasis vs. access emphasis vs. exclusivity emphasis
- Content depth before the ask: more context and proof vs. less context and a cleaner ask
- Alignment between CTA language in the email and the headline on the landing page
- Social proof positioning: testimonial above vs. below the CTA
Level 4 tests require conversion tracking that goes beyond your email platform’s built-in reporting. You need post-click data from your landing page analytics or CRM to confirm whether the email change produced a different outcome at the point of conversion.
Email A/B Testing Ideas Across Every Variable
The Email A/B Testing Priority Stack from the previous section tells you which level of the engagement funnel to focus your tests on. This section gives you the specific ideas within each level. We have organised every idea below by its recommended test metric and its Priority Stack level, so you can use this directly as a testing plan rather than a list of options to sort through later.
One standing note applies to every idea in Level 1: where the variable affects open rate, measure the result by click-through rate rather than open rate. Apple Mail Privacy Protection pre-loads tracking pixels and inflates open counts regardless of whether the subscriber actually read the email. Every subject line and from name test in this section should be evaluated by CTR.
Email A/B Testing Ideas for Subject Lines
Subject line testing sits in Level 1 of the Priority Stack. It is the right starting point when your open rate is the gap in your programme. We have limited this list to ideas with a clear, testable mechanism rather than an exhaustive inventory of possibilities.
| Test Idea | What You Are Testing | Recommended Metric | Priority Stack Level |
|---|---|---|---|
| First name vs. no personalisation | Whether direct address increases engagement | CTR | Level 1 |
| Question format vs. statement format | Curiosity-driven vs. direct value offers | CTR | Level 1 |
| Under 40 characters vs. 60+ characters | Whether brevity or context serves your audience | CTR | Level 1 |
| Urgency framing vs. neutral framing | “Ends tonight” vs. no time reference | CTR | Level 1 |
| Benefit-led vs. curiosity-led | “Cut your bounce rate” vs. “Something we found in your data” | CTR | Level 1 |
| Emoji inclusion vs. no emoji | Visual differentiation in a crowded inbox | CTR | Level 1 |
| Lower case vs. sentence case | Perceived tone and informality | CTR | Level 1 |
| Specific number vs. no number | Specificity as a credibility signal | CTR | Level 1 |
Email A/B Testing Ideas for Copy and Content
Copy and content testing belongs in Level 2. You enter Level 2 when your open rate is on benchmark but click-through rate is underperforming. The test metric throughout is click-through rate.
| Test Idea | What You Are Testing | Recommended Metric | Priority Stack Level |
|---|---|---|---|
| Long copy vs. short copy | Whether your audience needs context before acting | CTR | Level 2 |
| Conversational tone vs. professional tone | Register and voice preference for your segment | CTR | Level 2 |
| Problem-led opening vs. benefit-led opening | Which emotional frame drives more action | CTR | Level 2 |
| Dynamic personalised content vs. generic copy | Whether segment-specific messaging outperforms broadcast | CTR | Level 2 |
| Social proof above the fold vs. below the fold | Whether peer validation works before or after the main message | CTR | Level 2 |
| One image vs. multiple images | Whether visual density helps or hinders readability and clicks | CTR | Level 2 |
| Plain text format vs. HTML template | Whether a personal-looking email outperforms a designed one | CTR | Level 2 |
| Headline-and-subtext layout vs. narrative prose | Scannable structure vs. flowing argument | CTR | Level 2 |
Email A/B Testing Ideas for CTAs and Design
CTA testing sits in Level 2 and consistently produces some of the most reliable, repeatable results across email programmes. Small changes in CTA copy and placement produce measurable lift in click-through rate with relatively modest sample requirements, making it a high-return area for early testing investment.
| Test Idea | What You Are Testing | Recommended Metric | Priority Stack Level |
|---|---|---|---|
| Generic CTA vs. action-specific copy | Whether specificity drives more clicks than broad language | CTR | Level 2 |
| Button CTA vs. text link CTA | Format preference and visual weight | CTR | Level 2 |
| Single CTA vs. two CTAs | Whether multiple options increase or reduce action | CTR | Level 2 |
| CTA above the fold vs. after content | Whether the call to action needs to be earned with context first | CTR | Level 2 |
| High-contrast button colour vs. brand colour | Visual attention in relation to click engagement | CTR | Level 2 |
| Large button vs. standard-size button | Whether the physical size of the clickable area affects response | CTR | Level 2 |
| First-person CTA copy vs. second-person copy | “Start my free clean” vs. “Start your free clean” | CTR | Level 2 |
Email A/B Testing Ideas for Send Time and From Name
Send time testing belongs in Level 3, which is the right focus when opens and clicks are within range but performance consistency varies across sends. From name testing technically sits in Level 1 because it affects the open decision, but we address it here because it is most usefully tested alongside timing variables in the same testing window.
The same MPP measurement rule applies: evaluate send time tests and from name tests by click-through rate rather than open rate.
- Tuesday morning vs. Wednesday morning: tests whether the marginal mid-week advantage holds for your specific audience and list composition
- Morning send (9 to 10 AM) vs. early afternoon send (2 to 3 PM): tests whether a pre-work or post-lunch context drives better engagement for your segment
- Weekday send vs. Saturday morning: most relevant for consumer lists where weekend attention may outperform a crowded weekday inbox
- Brand name from field vs. personal name from field: tests trust and familiarity signals in the sender identity
- Full name vs. first name only: tests whether formality in the sender identity affects engagement
- Company name vs. name at company format: “MailCleanup” vs. “Alex from MailCleanup” — tests whether a human attribution feels more personal to your audience
How to Run A/B Testing in Email Marketing: A Step-by-Step Process
The six steps of a valid email A/B test were introduced in the process overview in H2 1. This section develops each step with the execution detail that separates tests producing reliable, actionable results from tests producing confident-sounding answers to questions you were not actually asking.
The most important structural principle before the steps: A/B testing in email marketing is a scientific method applied to a behavioural channel. The value of the method depends entirely on how strictly its requirements are followed. A test with a design flaw does not produce an unreliable result you can discount. It produces a false result that looks identical to a valid one.
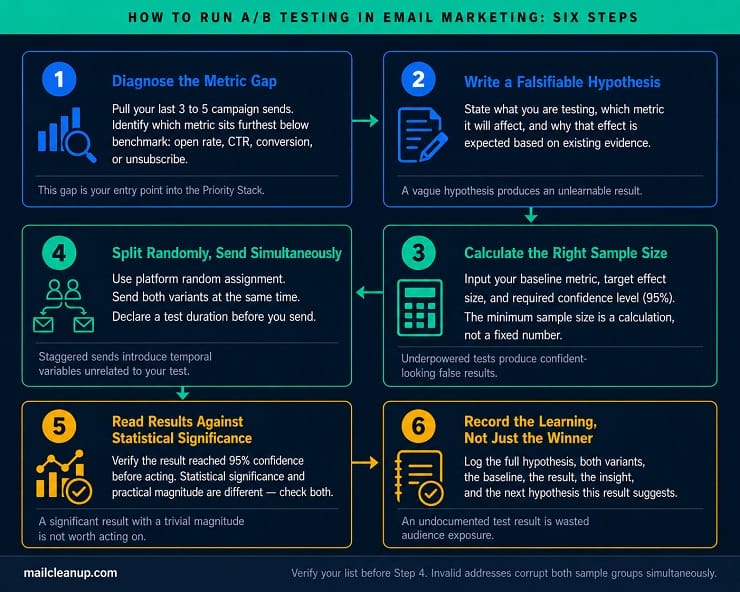
Step 1: Diagnose Your Metric Gap Before Starting Email A/B Testing
Before you choose a variable, write a hypothesis, or open your testing platform, pull your last three to five campaign sends and measure your current performance against your benchmark on each of the four funnel metrics: open rate, click-through rate, conversion rate, and unsubscribe rate. The metric with the largest gap below benchmark is your diagnostic entry point into the Priority Stack.
This step is absent from almost every email A/B testing guide. Most begin with “choose what to test.” That is the second decision, not the first. Beginning with variable selection defaults you to testing what is easy to change rather than what corresponds to your actual performance gap. A programme that tests only subject lines while its CTR sits at 0.8% is applying precision to the wrong problem entirely.
Step 2: Forming the Right Hypothesis for Email A/B Testing
A valid hypothesis for email A/B testing has three components: the specific change being made, the metric it is expected to affect, and the reason that effect is expected based on evidence already available.
This structure is correct: “Adding the subscriber’s industry to the subject line will increase click-through rate by at least 3 percentage points, because our previous industry-segmented sends generated 40% higher CTR than our general broadcast campaigns.”
This structure is not: “The shorter subject line will probably do better.”
The reason specificity matters is forward-looking, not procedural. A well-formed hypothesis, proved or disproved, teaches you something specific about your audience. A vague hypothesis teaches you nothing regardless of which variant wins, because you never committed to what you expected and why. A disproved hypothesis built on clear reasoning is more useful than a confirmed result built on intuition, because the disproof tells you where your assumptions about your audience were wrong.
Step 3: Determine the Right Sample Size for Valid A/B Testing in Email Marketing
Sample size for A/B testing in email marketing is not a universal threshold. It is a calculation with three inputs you must supply before the test starts:
- Your current baseline rate for the metric you are testing. Pull this from your last five sends against that specific metric.
- The minimum improvement you consider worth acting on. A 3 percentage point lift requires a much larger sample than a 10 percentage point lift to reach the same confidence level.
- Your required confidence level. 95% is the standard. Reducing to 90% lowers your sample size requirement but increases the probability of acting on a false positive.
Most email platforms automate significance calculations. Before trusting your platform’s automatic winner selection, check which confidence threshold it uses. Some default to 80% or 90%. A winner declared at 80% confidence carries a 1-in-5 chance the result was random variation rather than a genuine signal.
Step 4: Splitting, Timing, and Duration in Email A/B Testing
Random split is non-negotiable. Segment-based splits introduce selection bias because your segments are not behaviourally equivalent. If variant A goes to your most engaged subscribers and variant B to your least engaged, the performance gap reflects list quality rather than copy quality. Use your platform’s built-in random assignment without overriding it.
Send both variants at the same time. Not within the same hour. At the same time. Temporal variables including day-of-week engagement patterns, news cycle effects, and time-zone distribution in a geographically mixed list will affect results when sends are staggered by even a few hours.
On duration: the minimum is 48 hours for open rate tests. For click and conversion tests, allow 72 hours to one week. Your audience does not process email immediately or uniformly. Results from the first four to six hours reflect your most engaged subscribers, not your full audience. Declaring a winner at the first promising result is one of the most consistent ways to generate false positives from an otherwise well-designed test.
Step 5: Interpreting Your Email A/B Testing Results Against Statistical Significance
Statistical significance tells you the probability that the difference between your two variants was produced by the variable you tested rather than by chance. A 95% significance level means a 5% probability the difference was random. Most platforms surface this automatically, but two errors are still common:
Calling a winner when significance has not been reached. A 3 percentage point gap in open rate on a 500-person sample can occur entirely by chance. The number “looks” meaningful. It is not.
Acting on a statistically significant result with a trivially small magnitude. Significance and importance are different things. A result can be statistically significant and practically useless simultaneously, particularly on very large samples where minor random fluctuations routinely reach significance thresholds.
When your test does not reach significance, the honest options are: extend the test duration to capture more sends, increase your sample allocation, or increase the size of the change you are testing. Declaring a winner from an underpowered test and building future campaigns on it is not testing. It is guessing with extra steps and the false confidence that comes from having run an experiment.
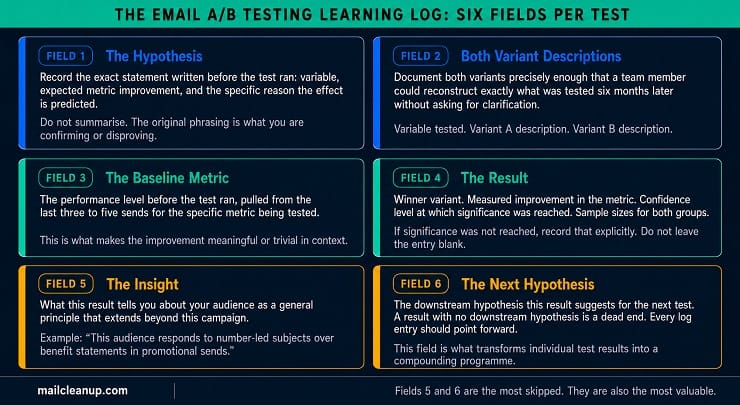
Step 6: From Email A/B Testing Win to Documented Learning
Sending the winning variant to your remaining list is correct but incomplete. The winning variant is an output. The learning is the asset.
After every email A/B test, record these six items in a shared test log:
- The hypothesis you started with, in full
- The variable tested and the two variant descriptions
- The baseline metric before the test ran
- The result: winning variant, improvement in the metric, confidence level achieved
- The insight: what this result reveals about your audience’s preferences or behaviour
- The next hypothesis this result suggests
This log transforms individual tests into a compounding programme. Twelve well-documented tests build a body of knowledge about what your specific audience responds to that no benchmarking report can provide. We return to this in H2 8 with the full framework for building that programme systematically.
Email A/B Testing Best Practices That Actually Hold Up
The conventional email A/B testing best practices are well established: test one variable at a time, start with a hypothesis, use random splits, run tests long enough to reach significance, document results. Most of that holds. Some of it needs qualification. A small portion of what circulates widely as best practice produces results that resemble optimisation without actually being optimisation.
In this section we separate what genuinely holds up under scrutiny, what needs a caveat applied, and the conditions under which the right decision is not to test at all.
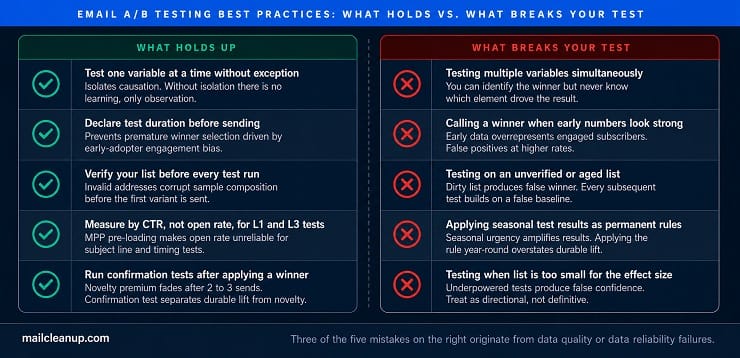
The One-Variable Rule and Why It Matters for Email A/B Testing
The one-variable rule is the correct principle, consistently understated. Most guides present it as a constraint: change only one thing. What they rarely explain is why the constraint exists at a methodological level.
The value of any email A/B test is its ability to isolate causation. That is only possible when one thing differs between the two variants. If you change the subject line and the CTA copy simultaneously, you can identify which email performed better. You cannot know whether the subject line or the CTA drove the difference. More consequentially, you cannot carry any specific mechanism forward into your next hypothesis, because you have not confirmed what worked. Testing multiple variables simultaneously does not halve the efficiency of the test. It eliminates the learning value entirely.
The only legitimate exception is when you are testing an overall email experience rather than a specific element: a full template redesign, a structural shift in how you frame an offer, or a wholesale change in voice. In those cases you are doing a directional check, not an isolating experiment. Treat the result as directional evidence and not as the foundation for a standing hypothesis about a specific element.
Setting Duration and Timing Conditions for A/B Testing in Email Marketing
Declare your test duration before you send. The most consistent way to generate false positives from an otherwise well-designed test is to stop early because the early numbers look decisive. Early data overrepresents your most engaged subscribers. By the time the full audience has had opportunity to interact with both variants, the apparent winner from the first six hours may have changed.
Minimum and recommended durations by test type:
| Test Type | Minimum Duration | Recommended Duration |
|---|---|---|
| Subject line (CTR-based) | 48 hours | 72 hours |
| CTA copy or placement | 48 hours | 5 to 7 days |
| Email copy or length | 72 hours | 5 to 7 days |
| Send time | One full week | Two to three weeks across multiple sends |
| Offer or incentive type | 72 hours | 7 days plus post-click conversion window |
| From name | 48 hours | 72 hours |
Avoiding the Seasonality and Novelty Traps in Email A/B Testing
Two temporal effects produce test results that do not generalise, and both lead to misapplied learnings if the test is treated as a permanent programme rule:
- The seasonality trap – A subject line tested during a Black Friday campaign may win because of urgency language, but the win was amplified by the heightened purchase intent of the season. Apply that same subject line formula year-round and the effect will be weaker because the seasonal context is absent. Results from high-engagement seasonal periods should be treated as directional evidence within that period, not as standing rules for the rest of the year.
- The novelty trap – A new email format, a different from name, or a fresh design often produces a short-term lift simply because it is different from what subscribers expect. That novelty premium dissipates after two to three sends once the element has become familiar. Running a confirmation test three to four sends after applying a winning variant is an underused discipline in most email A/B testing programmes. Without it, you will systematically overestimate the durable value of format and design changes.
When Email A/B Testing Is Not the Right Call
These conditions indicate that a test will not produce reliable or actionable results. Proceeding in any of these circumstances generates false confidence, which is worse than no data:
- Send frequency below two sends per month to the same segment. Sample size builds too slowly to reach statistical significance within a window that makes the result relevant.
- List smaller than 2,000 subscribers for most test types. Below this level, most effect sizes of practical significance cannot be detected reliably at 95% confidence. Run 50/50 splits and treat every result as directional, not definitive.
- One-time or seasonal campaigns. A test on a Christmas send cannot be validated until the following Christmas. The learning sits dormant for eleven months.
- When inbox placement is broken. If open rates have dropped sharply due to deliverability damage, running email A/B testing on subject lines or copy is testing the wrong variable. A damaged sender reputation suppresses engagement for both variants equally. Fix email sender reputation before testing creative.
- When your list is unverified. We cover the full mechanism in H2 9: unverified lists produce corrupted test data. A methodologically perfect test run on a dirty list still produces a meaningless result, because invalid and undeliverable addresses are undermining both sample groups before the test even begins.
A/B Testing Email Campaigns vs. Triggered Sequences
Most email A/B testing guidance is written exclusively around broadcast campaigns: a newsletter, a promotional send, or an announcement distributed to a defined segment of your list. Broadcast testing is the natural entry point because it is structurally simple to instrument. It is also, in most programmes, the lower-leverage testing environment.
The reason matters. Understanding it determines where you allocate your testing effort.
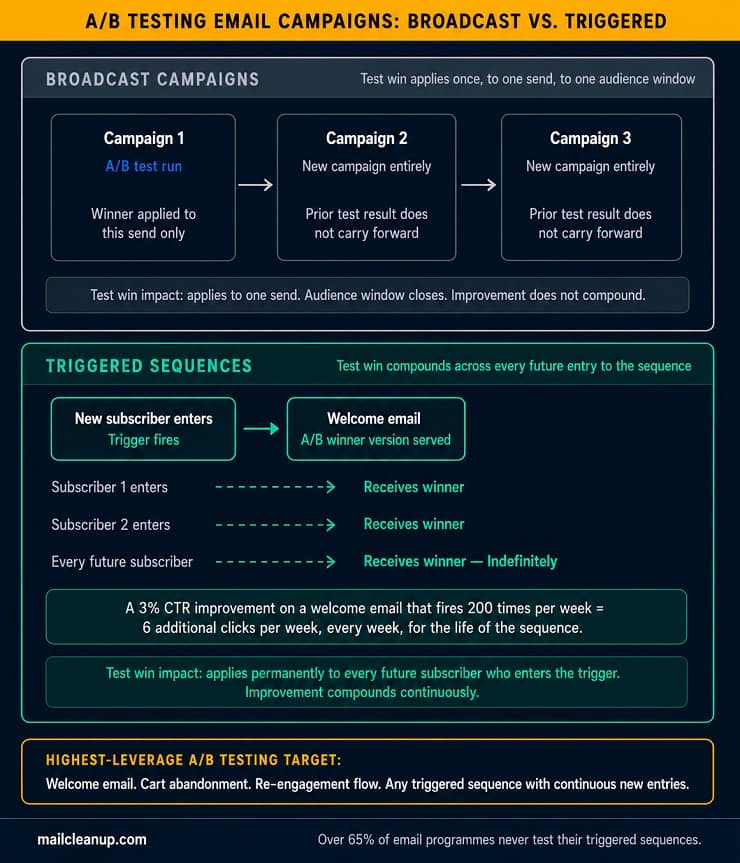
Why Triggered Sequences Outperform Broadcast for Email A/B Testing
A test win on a broadcast campaign applies once, to that send, to that audience window. A test win on a triggered automated sequence applies to every future subscriber who enters that trigger from the moment the winning variant goes live, indefinitely, until the next test supersedes it.
This is not a marginal difference in efficiency. It is a structural difference in how much value a single test result can generate over time. A welcome email that triggers for every new subscriber is a more valuable A/B testing target than any one-off promotional campaign, because the audience for that sequence replenishes itself continuously. The same principle applies to every automated flow in a programme.
The practical implications of this compounding structure:
- A 3% CTR improvement on a weekly broadcast newsletter applies to one week of sends before the next campaign replaces it
- A 3% CTR improvement on a cart abandonment email that fires 200 times per week compounds into 200 additional engagement events every week, every month, for the life of that sequence
- Welcome emails are the single highest-leverage A/B testing target in any programme with active list growth, because every new subscriber enters the sequence and the winning variant applies to all of them immediately
- Post-purchase and re-engagement sequences run continuously at commercially critical moments in the subscriber relationship, making them disproportionately high-value targets that over 65% of email programmes never test
Email A/B Testing Ideas for Welcome, Cart Abandonment, and Re-engagement Flows
Each triggered sequence type has a specific leverage point and a specific metric that best reflects whether the test produced a genuine improvement. The table below maps the highest-value A/B testing ideas to each sequence type.
| Triggered Sequence | Best A/B Testing Ideas | Evaluation Metric | Why It Compounds |
|---|---|---|---|
| Welcome email | Subject line personalisation; benefit-led vs. community-led framing; copy length | CTR | Every new subscriber enters this sequence; wins apply permanently to all future entries |
| Welcome series (Day 2 to 5) | Content sequence order; value delivery vs. product introduction framing; single CTA vs. guided journey | CTR | Sets the long-term engagement baseline for every subscriber who joins the list |
| Cart abandonment | Urgency framing vs. neutral framing; incentive inclusion; timing at 1 hour vs. 3 hours post-abandonment | Conversion rate | Triggers on every abandoned cart; even a 1% conversion lift compounds across thousands of annual triggers |
| Re-engagement | Tone: win-back framing vs. low-pressure check-in; offer type; unsubscribe framing | CTR + unsubscribe rate | Directly affects list health, sender reputation, and the quality of every subsequent send |
| Post-purchase | Social proof placement; cross-sell framing; review request timing | CTR + conversion rate | Affects every buyer’s post-purchase experience and directly influences repeat purchase behaviour |
How to Run Email A/B Testing in Automated Sequences Without Breaking the Flow
A/B testing email campaigns in a broadcast context is structurally straightforward: split the list, send both variants simultaneously, measure. Running email A/B testing inside automated sequences requires more careful setup to avoid disrupting active subscriber journeys or contaminating the test population with subscribers who entered the flow at different stages.
The five-step process for a valid test inside an automated sequence:
- Duplicate the automation in full: Create an exact copy of the sequence that will serve as variant B. Change only the one element you are testing at the specific step being tested. All other steps in both variants must be identical.
- Split at the entry point, not mid-sequence: Apply a random 50/50 split at the trigger entry point before subscribers enter either variant. Subscribers who are already inside the active flow should not be reassigned. Splitting mid-sequence contaminates both groups with subscribers whose earlier journey experience was different.
- Set a minimum entry threshold before evaluating: Do not evaluate results until at least 250 to 500 subscribers have completed the relevant step in each variant. For lower-volume automated sequences, this may mean running the test for several weeks.
- Evaluate at 95% confidence, not at a fixed calendar date: Unlike broadcast tests with a defined send date, automated sequence tests accumulate entries over time. Declare a winner when the significance threshold is met, not at an arbitrary two-week mark.
- Archive the losing variant before deactivating it: The losing variant’s hypothesis, result, and insight belong in your test log. Deactivate the losing sequence only after the learning has been recorded.
How to Build an Email A/B Testing Programme, Not Just Run Tests
There is a structural difference between running email A/B testing on a regular basis and building an email A/B testing programme. Most marketing teams do the former without realising it, and that distinction explains why many programmes accumulate a series of individual results that do not add up to meaningful, directional progress.
Running tests produces results. Building a programme produces knowledge that compounds. The compounding comes from treating every documented test outcome as the raw material for the next hypothesis, rather than as a standalone result to apply and move on from. An undocumented test result is wasted audience exposure. A well-documented result generates two assets: the improved variant and the insight about your audience that no industry benchmark can provide.
Building Your Email A/B Testing Log: What to Record After Every Test
The six test log components introduced in Step 6 of H2 5 are the operational foundation of a compounding email A/B testing programme. Recording only the winner, which is what most teams do, captures the output and discards the mechanism. The six items that must be recorded after every test:
- The hypothesis in full: The exact statement written before the test ran, including which metric was expected to improve and the specific reason that effect was predicted. Do not summarise. The original phrasing matters because it is what you are confirming or disproving.
- The variable and both variant descriptions: Precise enough that a team member reading the log six months later could reconstruct exactly what was tested without asking for clarification.
- The baseline metric before the test: The performance level you were starting from, pulled from the three to five sends immediately preceding the test. This is what makes the improvement meaningful or modest in context.
- The result: Winning variant. Measured improvement. Confidence level at which significance was reached. Sample sizes for both groups. If significance was not reached, record that explicitly rather than leaving the entry blank.
- The insight: What this result tells you about your audience’s preferences or behaviour, stated as a general principle that extends beyond this one campaign. For example: “This audience responds significantly better to number-led subject lines than to benefit statements when the campaign type is promotional.”
- The next hypothesis this result suggests: The forward-looking element most programmes skip entirely. A result that generates a downstream hypothesis is a compounding learning event. A result with no downstream hypothesis is a dead end. Every entry in the log should point forward.
How Insights Compound When You Build From Email A/B Testing Results
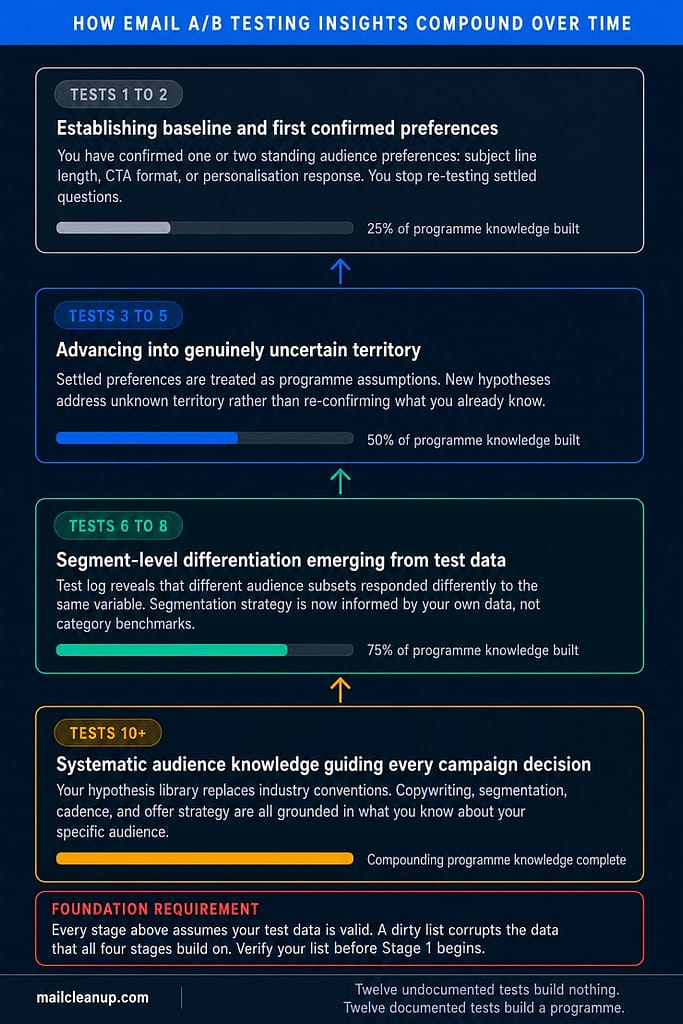
The compound effect of a maintained test log does not manifest immediately. It becomes visible around the fourth to sixth test, when the hypotheses you are writing are no longer sourced from industry conventions but from your own programme’s documented evidence about how your specific audience behaves.
By test three, you have confirmed one or two standing preferences: your subscribers respond better to short, direct subject lines than to conversational ones, or they engage more strongly with access-framed CTAs than with savings-framed ones. These become assumptions you stop re-testing and start building on, which frees your next test to advance into genuinely unknown territory.
By test six or seven, your hypothesis library tells you which elements your audience has already settled preferences on, which remain genuinely uncertain, and which behave differently in triggered sequences than in broadcast campaigns. The result is not just a set of incrementally better-performing emails. It is a body of audience knowledge that informs decisions across the programme:
- Email segmentation strategy, because documented test results tell you which audience subsets responded differently to the same variable and why
- Copywriting standards that reflect confirmed audience preferences rather than category conventions from a guide written for someone else’s list
- Campaign planning, because your test log tells you which elements need re-testing after major list changes, seasonal periods, or significant shifts in send frequency
- Deliverability decisions, because engagement patterns documented across tests reveal which segments are contributing consistently positive signals and which are drifting toward disengagement
How Email A/B Testing Connects to Your Wider Email Marketing Strategy
An email A/B testing programme does not operate independently of your broader email marketing guide and the strategic objectives it sits within. The test results that matter most are the ones connected to the metrics your programme is ultimately accountable for: revenue generated from email, conversion rate from email to goal completion, and long-term list health as measured by engagement trends and unsubscribe rates over time.
Connecting testing to strategy requires building hypotheses from strategic goals rather than from available variables. If your programme’s primary objective for the current quarter is improving conversion rate from email, your testing priority is Level 4 of the Priority Stack: offer framing, incentive type, and the alignment between your email CTA and the landing page it points to. Testing subject lines in that context may improve open rate while having no direct path to the conversion goal you are accountable for.
The practical test for whether your email marketing A/B testing programme is connected to strategy is straightforward: every test log entry should include a one-line statement of which business metric the test was designed to advance. If that line cannot be written without forcing the connection, the test was driven by convenience rather than by the priorities your programme exists to serve.
Why Email A/B Testing Requires a Verified List to Produce Valid Results
We have covered three sources of corrupted email A/B testing data across this guide: Apple Mail Privacy Protection’s effect on open rate measurement, insufficient sample sizes for the effect size being tested, and design errors that make otherwise well-structured tests unreliable. This section addresses the fourth source, which sits beneath all three of the others and is the one no amount of methodological rigour can compensate for once it is present.
Every email A/B test is run on your list. If that list contains invalid addresses, undeliverable addresses, and addresses that have silently decayed into non-engagement, your test data is corrupted before you write the first line of variant copy. This is not a marginal accuracy issue. It is a structural problem with the data your entire testing programme is built on, and it affects both variants of every test simultaneously.
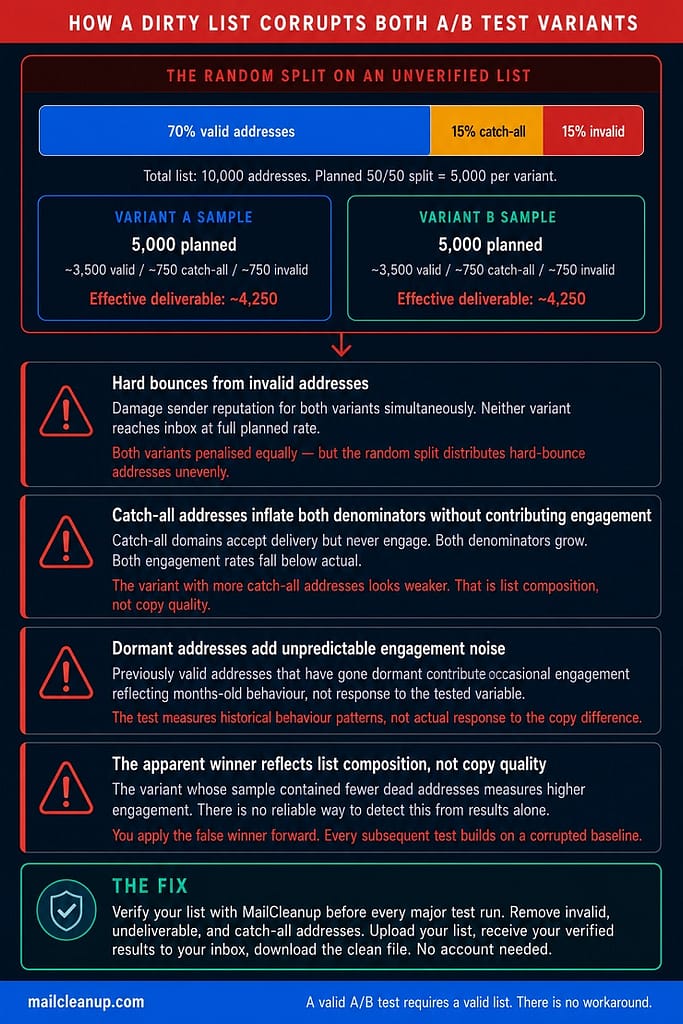
How Invalid Addresses Corrupt Both Variants in Email A/B Testing
The mechanism by which list quality corrupts email A/B testing results operates at the denominator level. When your platform calculates open rate or click-through rate for each variant, it divides positive engagement events by the total number of addresses in each sample group. Invalid and non-responsive addresses inflate those denominators without contributing any positive engagement signals, suppressing the measured rates for both variants simultaneously.
The critical point is that random splits are statistically equal in expectation but not perfectly equal in address composition. When one random half happens to contain a higher concentration of dormant or undeliverable addresses than the other, the performance gap between the two variants reflects list composition rather than copy quality. The specific ways a dirty list corrupts both sample groups before a test result can be trusted:
- Hard bounces from invalid addresses reduce your effective deliverable sample below your planned split size, pushing both variants toward the underpowered threshold where significance cannot be reliably reached
- Catch-all domain addresses that accept delivery but never engage inflate the denominator for whichever variant they land in, systematically suppressing that variant’s measured rates regardless of content quality
- Previously valid addresses that have gone dormant add unpredictable noise to both groups: they occasionally open or click in patterns that reflect months-old behaviour rather than genuine response to the variable being tested
- Spam trap addresses, if present, suppress inbox placement for the entire send through deliverability damage, reducing the number of valid addresses that actually receive either variant at all
- Duplicate addresses that were not removed before splitting may appear in both sample groups and register engagement signals against both variants, corrupting the comparison by counting one subscriber’s response twice
The Dirty List Effect on Statistical Significance in A/B Testing for Email
The practical consequence of these corruption mechanisms is that a dirty list raises the sample size required to reach valid statistical significance while simultaneously reducing the effective deliverable sample available to you. Both effects push in the same direction: away from a result you can trust.
The table below illustrates how invalid address rates affect the effective sample size on a 10,000-subscriber test cohort split 50/50, and what that means for significance:
| Invalid Address Rate | Planned Per-Variant Sample | Effective Deliverable Per-Variant | Impact on Test Reliability |
|---|---|---|---|
| 2% (verified clean list) | 5,000 | 4,900 | Minimal. Most standard tests remain above the significance threshold. |
| 8% (average unverified list) | 5,000 | 4,600 | Moderate. Tests requiring larger samples may fall below the reliability threshold. |
| 15% (degraded or aged list) | 5,000 | 4,250 | Significant. Small-effect tests will not reach 95% confidence regardless of the variable. |
| 25% (purchased or legacy list) | 5,000 | 3,750 | Severe. Most tests are structurally underpowered before they begin. |
Beyond the sample size effect, a high invalid address rate accumulates hard bounces that damage email sender reputation. Deliverability damage reduces inbox placement rates for both variants, meaning both are being evaluated against a degraded baseline that has nothing to do with the content being tested. The result you get is not which variant is better. It is which variant performed less badly given the deliverability penalty your list is already carrying into the send.
How to Verify Your List Before Every Email A/B Testing Send
Email list hygiene before a test run is not a one-time exercise. Lists decay continuously. Addresses go dormant, domains expire, and catch-all addresses accumulate across any list that grows organically or through imports over time. Verification should be treated as a standing precondition for any test you intend to treat as reliable, not a remediation step applied when results start looking inconsistent.
The six-step process for verifying your list before a major email A/B testing send:
- Run a full multi-layer verification pass: Check syntax validity, domain and MX record health, SMTP deliverability, catch-all domain classification, and disposable address detection in a single pass. Single-layer syntax checking removes formatting errors but leaves undeliverable, dormant, and high-risk addresses intact. At MailCleanup, we run verification across all layers, including risk scoring, duplicate detection, and catch-all classification, and return the verified results directly to your inbox. Upload your list, receive the results, and download your clean file ready for splitting.
- Remove hard-bounce categories immediately: Addresses flagged as invalid, non-existent, or permanently undeliverable are removed from the test cohort before splitting. They cannot contribute valid engagement signals and will only suppress measured rates across both variants.
- Segment your catch-all addresses separately: Catch-all domains accept all incoming email regardless of whether the specific address exists. They inflate your deliverable count without guaranteeing genuine engagement. Remove catch-all addresses from your primary test cohort or run them as a separate, clearly labelled group whose results you treat independently.
- Remove duplicates before splitting: Duplicate addresses in a split test may appear in both sample groups and produce engagement signals that count against both variants simultaneously. How to clean email lists covers deduplication as a core pre-send step.
- Assess list age by last engagement date: If a meaningful portion of your list has not engaged in six or more months, run a re-engagement segment before including those addresses in an A/B test. Dormant addresses introduce engagement patterns that reflect historical behaviour rather than genuine response to the variable you are testing.
- Record the verification baseline in your test log: Document your valid address percentage, the verification date, and the hard bounce rate from the most recent send alongside every test result. This allows you to track whether changes in test reliability correlate with changes in list quality over time, and to diagnose why a previously reliable test type is suddenly producing inconsistent results.
Your Email A/B Testing Results Are Only as Reliable as the List Behind Them
Every principle in this guide operates on a single shared assumption: that the list you are testing against contains addresses corresponding to real, reachable subscribers whose behaviour produces genuine engagement signals. When that assumption holds, the method works. The Priority Stack tells you where to focus. The six-step process produces results you can act on. The test log builds a compounding body of audience knowledge over time.
When the assumption does not hold, none of the rest matters. The winning variant from a test run on a degraded list may reflect genuine audience preference, or it may reflect which random sample half happened to contain fewer undeliverable addresses. There is no way to know from the data alone. The result looks identical either way. You apply it forward and compound the error across every subsequent test built on a false baseline.
This is why list verification sits at the foundation of a reliable email A/B testing programme and not at the end of a best practices checklist. Before any test runs, upload your list to MailCleanup, receive your verified results directly to your inbox, and download a clean file ready for splitting into your test cohort. No account needed. No dashboard to navigate. Your test population becomes what it should always have been: a sample of real, reachable subscribers whose responses mean something. That is the infrastructure that makes everything else in this guide worth running.
FAQs on Email A/B Testing
What is email A/B testing?
Email A/B testing is the practice of sending two versions of the same email, each with one element changed, to two randomly divided segments of your list. The variant that performs better against a predefined metric, such as click-through rate or conversion rate, wins. That winner is sent to the remaining subscribers or carried forward to inform future campaign decisions.
What should I A/B test in my emails first?
Start with the element that corresponds to your largest metric gap. If open rate is below benchmark, test subject line, preview text, and from name. If click-through rate is the gap, test CTA text and email copy. Testing the easiest element rather than the most relevant one is the most common reason email A/B testing programmes produce low-value results over time.
How long should an email A/B test run before I pick a winner?
Subject line and from name tests need a minimum of 48 hours. CTA and copy tests need 72 hours to one week. Send time tests need two to three weeks across multiple sends for results to be reliable. Declaring a winner from the first few hours overrepresents your most engaged subscribers and produces false positives at a significantly higher rate.
What sample size do I need to run a valid email A/B test?
There is no universal minimum. Your required sample size depends on your current baseline rate, the size of improvement you want to detect, and your required confidence level. At 95% confidence, detecting a 5 percentage point improvement on an 18% open rate requires approximately 1,400 subscribers per variant. At 40% baseline, the same detection requires around 2,400 per variant.
Does Apple Mail Privacy Protection affect email A/B testing results?
Yes, significantly for subject line tests. Apple Mail Privacy Protection pre-loads tracking pixels before a subscriber opens an email, inflating open rates regardless of actual engagement. Since subject line tests are typically evaluated by open rate, results are unreliable for any audience with a meaningful proportion of Apple Mail users. Evaluate subject line tests by click-through rate instead for accurate, actionable results.
What is the difference between A/B testing and multivariate testing for emails?
A/B testing changes one element and compares two variants. Multivariate testing changes multiple elements simultaneously and tests how combinations interact. A/B testing is the right approach for most email programmes because it requires smaller sample sizes and produces clear, attributable results. Multivariate testing requires at least 10,000 recipients per test to produce statistically valid results and is only worth running on high-volume lists.
How do I know if my email A/B test result is statistically significant?
Statistical significance tells you the probability that your result was produced by the variable tested rather than by chance. Most email platforms calculate this automatically. The standard threshold is 95%, meaning a 5% probability the result was random. Results that have not reached 95% confidence should be treated as directional indications, not as confirmed findings worth acting on in future campaigns.
Can I run email A/B tests if I have a small list?
Yes, with adjusted expectations. Lists under 2,000 subscribers cannot reliably reach statistical significance at 95% confidence for most effect sizes. Run 50/50 splits across your full list and treat every result as directional rather than definitive. Pooling results across three to five sends of the same test variable gives you more reliable signal than any single send can produce on a small list.