

Check your ESP’s dashboard right now, and it probably shows you an email deliverability rate somewhere in the high 90s. Feels good. But that number, a benchmark report’s number, and a different tool’s number don’t always come from the same formula. They can even share the exact same name.
Most guides on this topic skip past that problem entirely. They give you one formula, one benchmark figure, and a checklist of best practices. That’s the same three things nearly every article ranking for this term already covers. What they don’t tell you is which formula your own ESP is actually using. They also don’t mention that the two most commonly cited “2025” industry surveys on deliverability are the exact same dataset. It’s just published under two different names.
This guide does that work instead. You’ll get the actual formula behind the number your ESP shows you. You’ll also get the reconciled 2026 benchmarks with their real sources and dates attached, and what genuinely moves this specific rate. Not another repeat of the generic deliverability checklist you’ve probably already read somewhere else.
TL;DR
- Email deliverability rate is usually delivered emails divided by sent emails, times 100, the same math most sources mean by “delivery rate.”
- Inbox placement rate gets divided by total sent, by delivered emails, or by sent minus bounces, depending on the source.
- The global average email deliverability rate reached 87.2% in 2025, according to Validity’s 2026 benchmark report, up from 83.5% the year before.
- A widely-repeated 83.1% benchmark traces to a January 2024 test, while a separate, often-cited 96.43% figure likely uses a looser, delivery-rate-style definition.
- Every bounce a dirty list generates lowers the numerator in the delivered-over-sent calculation directly, not just a reputation score around it.
- Verified list hygiene is the fastest lever for improving this specific rate; authentication, complaint rate, and sending consistency matter too, but work more slowly.
What Is Email Deliverability Rate?
Your email deliverability rate tells you what share of the emails you send actually reach a mailbox. It’s measured against every message you attempted to send. Most tools express it as a percentage: delivered emails divided by sent emails, multiplied by 100.
That sounds simple, and for most everyday purposes it is. But the term hides a real disagreement among the tools and reports that use it. You’ll run into that disagreement the moment you compare your own number against someone else’s. Before you get to the formula itself, you need to know exactly what this number measures, and just as importantly, what it doesn’t.
The difference between email delivery and email deliverability already has a full explanation. It includes the six-factor framework that separates a one-time technical fix from a months-long reputation shift. This guide goes narrower. It’s also a different metric entirely from email deliverability score, which predicts risk before you send rather than measuring what already happened. This guide is about the specific number most people mean when they ask for their deliverability rate. Here’s what’s ahead: how to calculate email deliverability rate, what counts as a good result, and how to improve it. You’ll also see what the average email deliverability rate actually looks like, broken down by sender type and industry, later in this guide.
Email Deliverability Rate vs. Delivery Rate and Inbox Placement Rate
“Delivery rate,” “deliverability rate,” and “inbox placement rate” get used almost interchangeably online, and that’s part of the problem. They don’t all mean the same thing, and the sources that define them don’t agree with each other either.
Sinch Mailjet’s own research is explicit about the first pair. Delivery rate is delivered emails divided by sent emails, and a delivered email includes anything that reached a mail server, spam folder placements included. That’s also the email deliverability rate formula most calculators and ESP dashboards actually use. It shows up as a “deliverability” percentage no matter what the tool happens to call it.
Inbox placement rate is meant to answer a narrower question: how many of your emails actually landed in the inbox, not spam. Even here, the sources disagree on the denominator. Mailjet divides emails placed in the inbox by emails delivered. GetResponse divides inbox-and-other-folder placements by sent emails minus bounces. Validity, whose benchmark data you’ll see later in this guide, measures its inbox placement rate against total emails sent. Three real, currently published sources, three different denominators, one metric name between them.
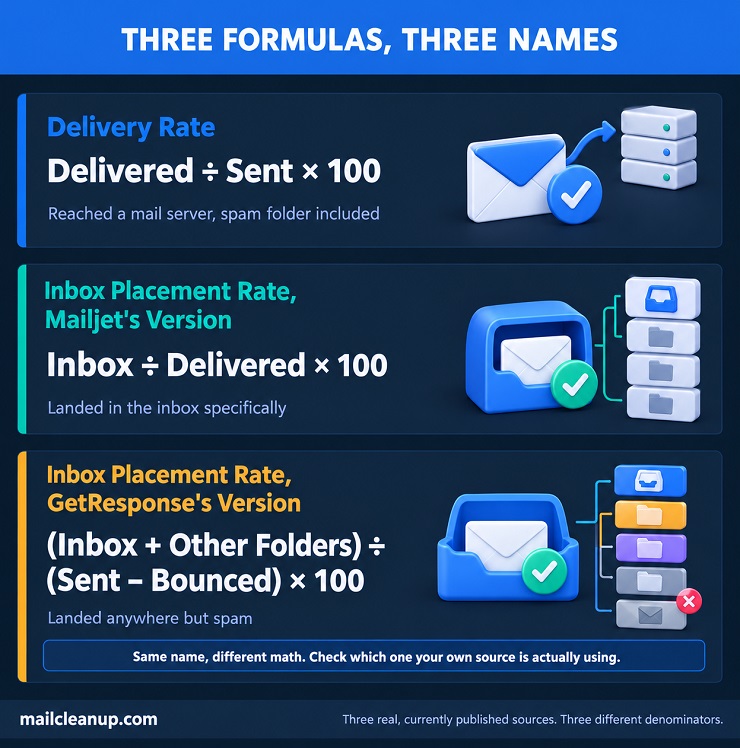
| Term | Formula | What counts as “delivered” |
|---|---|---|
| Delivery rate (and most tools’ “deliverability rate”) | Delivered / Sent * 100 | Reached a mail server, spam folder included |
| Inbox placement rate, Mailjet’s version | Inbox / Delivered * 100 | Landed in the inbox specifically |
| Inbox placement rate, GetResponse’s version | (Inbox + other folders) / (Sent – Bounced) * 100 | Landed anywhere but spam |
Here’s the practical takeaway. When your ESP or a benchmark study reports “email deliverability rate,” assume it’s using the simpler delivered-over-sent formula unless the source says otherwise. That’s the number this guide walks you through calculating next. If you want the stricter, inbox-only version instead, you need a seed test or a purpose-built tool. Your ESP’s own delivery report won’t measure it.
How to Calculate Email Deliverability Rate
Here’s how to calculate email deliverability rate: you need two numbers, how many emails you sent, and how many of those bounced. Delivered emails is simply sent minus bounced. Divide that by sent, multiply by 100, and you have your percentage.
The formula: (Sent – Bounced) / Sent * 100 is the email deliverability rate formula in its simplest, most common form.
Say you send a campaign to 25,000 addresses, and 875 of them bounce. Subtract the bounces from the total sent, and 24,125 emails were delivered. Divide 24,125 by 25,000, multiply by 100, and your email deliverability rate for that campaign is 96.5%.
That 96.5% answers one specific question: how many of your emails did a mail server accept? It doesn’t tell you how many of those 24,125 delivered emails actually reached an inbox instead of a spam folder. That’s the same delivered-includes-spam gap you saw earlier, showing up now as a real number instead of an abstract definition.
There’s a second thing this formula won’t tell you on its own. How much a single bounce actually moves the needle depends entirely on your volume.
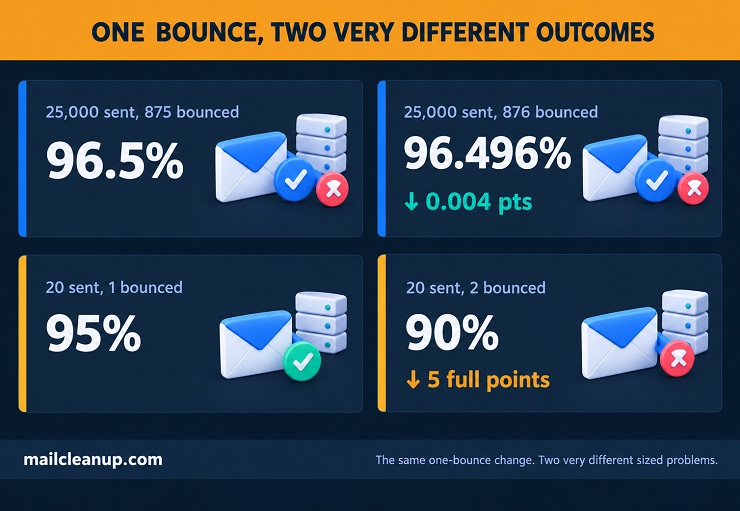
| Sends | Bounces | Delivered | Rate |
|---|---|---|---|
| 25,000 | 875 | 24,125 | 96.5% |
| 25,000 | 876 (one more) | 24,124 | 96.496% |
| 20 | 1 | 19 | 95% |
| 20 | 2 (one more) | 18 | 90% |
One extra bounce on the 25,000-send campaign moved the rate by four thousandths of a percentage point. The same single extra bounce on the 20-send campaign dropped it five full points, from 95% to 90%. Neither number is wrong. But the smaller sample makes the rate far more sensitive to one address. That matters if you’re comparing week-to-week numbers on a list that isn’t sending in bulk yet.
Most ESPs show your sent and bounce counts without any extra work. They usually sit on the same campaign report, sometimes broken into hard bounces and soft bounces separately. Add both bounce types together before you subtract. A hard bounce and a soft bounce both count as “not delivered” for this specific calculation. That’s true even though they mean very different things about the address itself.
You can run this calculation for a single campaign, a week, or a full month. Just be consistent about the window you’re using, especially at lower volume, where a shorter window makes the sample-size problem above even more pronounced. One more thing worth doing before you compare against any benchmark: calculate this separately for each type of email you send. Don’t collapse it into one blended number. A single average across your transactional receipts and your marketing campaigns hides more than it reveals. The benchmarks later in this guide are split the same way for exactly that reason.
What Is a Good Email Deliverability Rate?
What is a good email deliverability rate? Above 87%, though the honest answer depends on which source you’re comparing against and what it actually measured. Validity’s 2026 benchmark report puts the global average at 87.2%, based on 2025 data, up from 83.5% the year before. That’s a real 3.7-point year-over-year gain you can trust, not a rounding difference between two unrelated studies. Validity’s own report ties the gain to tighter mailbox-provider requirements. If you met the new authentication and complaint-rate bars, fewer of your emails got blocked or rejected outright. That’s what actually moved the average.
A caution before comparing: don’t average incompatible sources. EmailToolTester’s often-cited 83.1% figure comes from a January 2024 seed test, not current data. It still gets repeated in guides published this year. Compare sources by what they actually measured and when, not just by which number looks most authoritative.
That average email deliverability rate isn’t the same everywhere, though. It shifts by how you’re sending and who you’re sending to, which is where the email deliverability rate benchmark data below actually gets useful.
Email Deliverability Rate by Sender Type
Drip’s own benchmark data splits “good” by what you’re actually sending, and the gap between categories is wide.
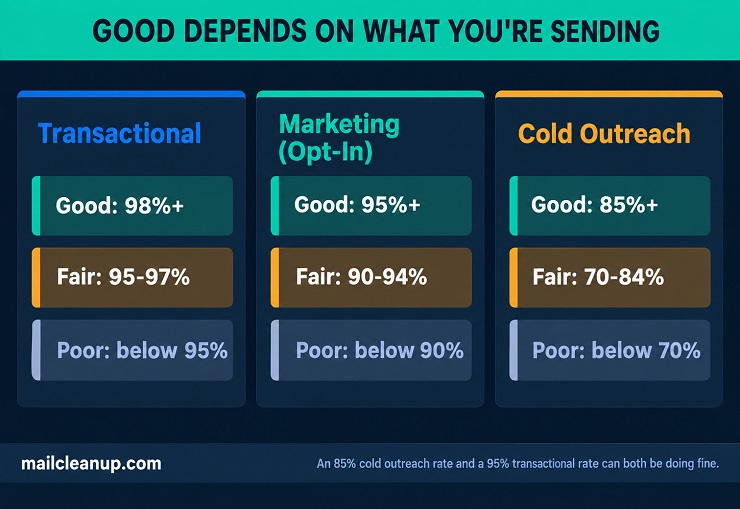
| Sender type | Good | Fair | Poor |
|---|---|---|---|
| Transactional | 98%+ | 95-97% | Below 95% |
| Marketing (opt-in) | 95%+ | 90-94% | Below 90% |
| Cold outreach | 85%+ | 70-84% | Below 70% |
A cold outreach rate that would be a five-alarm problem on a transactional account, 85%, is actually a solid result in its own category.
Email Deliverability Rate by Industry
Validity’s 2026 report breaks inbox placement down by industry too, and the spread is even wider than the sender-type gap above.
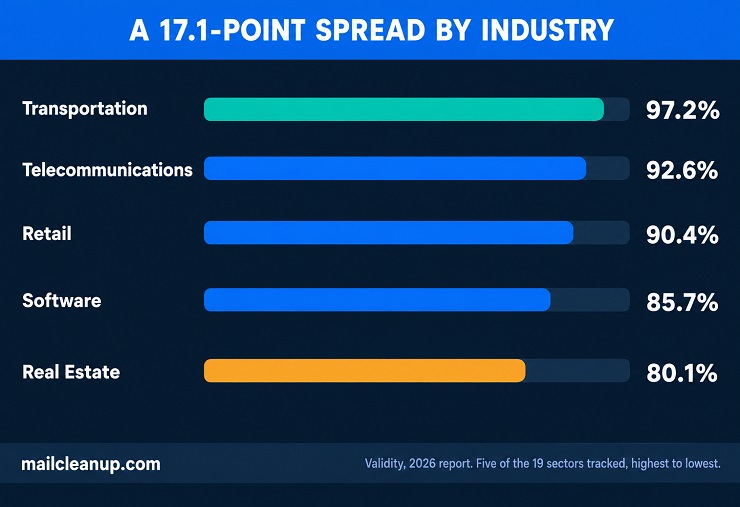
| Industry | Inbox placement rate |
|---|---|
| Transportation | 97.2% |
| Telecommunications | 92.6% |
| Retail | 90.4% |
| Software | 85.7% |
| Real estate | 80.1% |
That’s a 17.1-point gap between the top and bottom sectors shown here. Selzy’s own 2024 study puts overall deliverability at 96.43%, over nine points above Validity’s figure. Selzy’s methodology blends its own platform data with third-party reports from Statista, Litmus, and others, without stating an exact definition for that number. The size of the gap makes a simple delivered-over-sent calculation the likelier explanation, though that’s an inference, not something Selzy confirms directly. Same word, different number, for exactly the reason covered earlier in this guide.
These five are a slice of the 19 sectors Validity tracks, chosen to show the range rather than every point in between. If your own industry isn’t listed, look at how your sending behaves rather than what it’s called. Transportation and telecommunications sit at the top of both tables for the same reason. Their email is transactional and expected, shipping updates, service alerts, the kind of message a mailbox provider has little reason to distrust.
Real estate and cold outreach sit at the bottom of theirs for the same reason too. It’s unsolicited or semi-cold prospecting, and a mailbox provider has learned to treat that with more suspicion. The sender-type table above is often a better predictor of where you’ll land than your industry label is. For the full industry-by-industry and provider-by-provider breakdown beyond these five, our complete 2026 benchmark report covers all of it in one place.
Email Deliverability Rate by Region
Validity’s 2026 report also breaks inbox placement down by region, and the spread here is real too.
| Region | Inbox placement rate |
|---|---|
| Europe | 91.1% |
| South America | 88.0% |
| Oceania | 87.9% |
| North America | 86.7% |
| Asia | 86.4% |
If your list is concentrated in one region, your blended number will sit closer to that region’s figure. It won’t necessarily match the global 87.2% average. A US-heavy list and a Europe-heavy list can both be “on benchmark” for their own region. They can still look different against the single global number most guides quote.
If your own number falls short of the range that fits your sending type, industry, or region, the next section covers what happens next. You’ll find out how to improve email deliverability rate next, starting with the lever that moves fastest.
How to Improve Email Deliverability Rate
Two different things move your email deliverability rate, and they work on different timelines. Reducing bounces is fast; building sender reputation is slow. Here’s what to actually do, starting with the lever that moves fastest.
- Reduce bounces before you send: run your list through email list hygiene to catch invalid, disposable, and role-based addresses first. Every address removed here is one less bounce counted against you on your very next send. That’s the fastest lever on this specific number.
- Authenticate every sending domain: SPF, DKIM, and DMARC all need to be configured and aligned, not just present. A missing or misaligned record is one of the most common reasons a legitimate sender still gets blocked outright.
- Keep your complaint rate under roughly 0.1%: most mailbox providers treat anything higher as a warning sign now. A working one-click unsubscribe makes this easier to hold. A recipient who can leave in one click is less likely to hit “report spam” instead.
- Send consistently, not in bursts: a sudden jump in volume from a quiet sending history reads as suspicious, even from a clean list. Ramp up gradually if you’re about to send meaningfully more than usual.
Not All List Risk Shows Up as a Bounce
Reducing bounces is the fastest lever on this number, but not every address MailCleanup flags turns into a bounce. That gap changes how you should read your own rate.
| Category | Share of a typical list* | What happens if you mail it anyway |
|---|---|---|
| Undeliverable | 16.98% | Hard bounces almost every time. This is the number that lowers your numerator directly. |
| Accept-All | 7.32% | Usually accepted without a bounce. The server takes the message even when no real mailbox exists behind it, so it never counts against your bounce rate at all. |
| Unknown | 2.43% | Genuinely unresolved. Verification couldn’t confirm either way, and neither can you until you actually send. |
*Share of a typical list, based on MailCleanup’s Quality Report 2026, 12-month dataset (3,596,809 addresses). See the full verification statistics for the complete breakdown.
Accept-All is the one worth sitting with. It can pass straight through your delivered-over-sent calculation without ever touching your bounce count. That means a clean email deliverability rate can still be sitting on top of addresses nobody’s actually receiving. That’s the same gap covered earlier in this guide between delivered and inbox-placed, just one step earlier. An address can count as delivered and still never reach a person.
Verification catches all three before you send, not just the ones that would have bounced. For what Undeliverable and Accept-All addresses actually cost you, the cost of email bounces breaks down the confirmed and uncertain sides separately.
That’s the short list of what moves this specific rate. The six-factor framework covering the rest of deliverability, content quality, and engagement is covered in the dedicated post about email deliverability. This section only covers the part of the checklist that helps you improve email deliverability rate specifically.
Check Your Email Deliverability Rate Next
Run your email deliverability rate calculation once against your own most recent full month, not a single best campaign. A single good week can hide a real problem, the same volatility problem covered earlier in this guide. It’s just working in your favor this time instead of against you.
If the result sits below the email deliverability rate benchmark for your sending type and industry, check two things before changing anything else. First, what share of that month’s sends went to addresses you haven’t verified recently. Second, whether your bounce count is lumping in soft bounces from full inboxes or temporary server issues. Those resolve themselves on a retry and don’t actually reflect a list problem at all. Those two checks resolve most of the gap for most senders.
If they don’t, the problem has moved from your list to your reputation. That’s the slower rebuild covered in the section above, not something a recalculation fixes on its own.
FAQs on Email Deliverability Rate
What is a good email deliverability rate?
The honest answer to what is a good email deliverability rate depends on what you’re sending. But 87% or higher is a reasonable global floor, based on Validity’s 2026 report. Transactional email should clear 98%, opt-in marketing 95%, and cold outreach 85%, according to Drip’s own sender-type benchmarks. Compare your number against your own category, not a single flat target.
What’s the difference between delivery rate and deliverability rate?
Delivery rate and email deliverability rate are usually the same simple calculation: delivered emails divided by sent, spam-folder mail included. True inbox placement rate is stricter. It excludes spam-folder mail entirely and typically needs a seed test to measure, since your own dashboard can’t see inside anyone’s spam folder.
How do you calculate email deliverability rate?
To calculate email deliverability rate, subtract your bounces from your total sent, then divide by total sent and multiply by 100. If you sent 25,000 emails and 875 bounced, 24,125 were delivered, for a 96.5% rate. Add hard and soft bounces together first, since both count as “not delivered” for this calculation.
What’s the average email deliverability rate in 2026?
The global average email deliverability rate sits at 87.2%, according to Validity’s 2026 benchmark report, based on 2025 sending data. That’s up from 83.5% the year before, a real 3.7-point improvement tied to tighter mailbox-provider requirements taking hold. Averages vary widely by industry and sender type, so treat this as a starting reference, not a personal target.
Does email deliverability rate vary by industry?
Yes, email deliverability rate varies significantly by industry. Validity’s 2026 data shows Transportation at 97.2% inbox placement against Real Estate at 80.1%, a 17.1-point spread across the same measurement. The pattern tracks how transactional and expected your industry’s email tends to be. Highly transactional senders, like shipping notifications, consistently outperform cold or promotional outreach.
What causes a low email deliverability rate?
Email deliverability rate usually drops because of a high bounce rate from an unverified list, or missing and misconfigured authentication, SPF, DKIM, and DMARC. A spam complaint rate above roughly 0.1% also plays a role. Sudden spikes in sending volume from a previously quiet domain trigger mailbox-provider suspicion too. Most list-based causes are fixable within one sending cycle; reputation issues take months to resolve.
Is a delivered email the same as an inbox-placed email?
No. A “delivered” email only means a mail server accepted it, spam folder included, which is exactly what your email deliverability rate calculation counts. An inbox-placed email specifically reached the primary inbox, not spam or promotions. A campaign can show a 99% delivery rate and a much lower true inbox placement rate at the same time.
How can I improve my email deliverability rate?
The fastest way to improve email deliverability rate is starting with your list. Verified, clean addresses mean fewer bounces, which is the single biggest lever on this specific number. From there, authenticate every sending domain with SPF, DKIM, and DMARC. List fixes move the number within one send; reputation fixes take months to show up.